Jupyter Book and GitHub repo.
ROMS Regional Ocean Modeling System#
This notebook works with what Parker calls a ‘mooring extraction’. The ROMS model operates on a vast area divided into a 3D grid of cells. Given a lat/lon location of a ‘mooring’ we get the extraction from the full-volume model result.
import os, sys, time, glob, warnings
from os.path import join as joindir
from IPython.display import clear_output
from matplotlib import pyplot as plt
from matplotlib import colors as mplcolors
import numpy as np, pandas as pd, xarray as xr
from numpy import datetime64 as dt64, timedelta64 as td64

warnings.filterwarnings('ignore')

def doy(theDatetime): return 1 + int((theDatetime - dt64(str(theDatetime)[0:4] + '-01-01')) / td64(1, 'D'))
def dt64_from_doy(year, doy): return dt64(str(year) + '-01-01') + td64(doy-1, 'D')
def day_of_month_to_string(d): return str(d) if d > 9 else '0' + str(d)

print('\nJupyter Notebook running Python {}'.format(sys.version_info[0]))
Jupyter Notebook running Python 3
s=xr.open_dataset("../data/roms_osb_july_2021.nc")
s
---------------------------------------------------------------------------
KeyError                                  Traceback (most recent call last)
File ~/micromamba/envs/geosmart-template/lib/python3.12/site-packages/xarray/backends/file_manager.py:211, in CachingFileManager._acquire_with_cache_info(self, needs_lock)
    210 try:
--> 211     file = self._cache[self._key]
    212 except KeyError:

File ~/micromamba/envs/geosmart-template/lib/python3.12/site-packages/xarray/backends/lru_cache.py:56, in LRUCache.__getitem__(self, key)
     55 with self._lock:
---> 56     value = self._cache[key]
     57     self._cache.move_to_end(key)

KeyError: [<class 'netCDF4._netCDF4.Dataset'>, ('/home/runner/work/oceanography/oceanography/book/data/roms_osb_july_2021.nc',), 'r', (('clobber', True), ('diskless', False), ('format', 'NETCDF4'), ('persist', False)), 'd1456bfe-477e-4633-ab26-2b7d214988ef']

During handling of the above exception, another exception occurred:

FileNotFoundError                         Traceback (most recent call last)
Cell In[2], line 1
----> 1 s=xr.open_dataset("../data/roms_osb_july_2021.nc")
      2 s

File ~/micromamba/envs/geosmart-template/lib/python3.12/site-packages/xarray/backends/api.py:687, in open_dataset(filename_or_obj, engine, chunks, cache, decode_cf, mask_and_scale, decode_times, decode_timedelta, use_cftime, concat_characters, decode_coords, drop_variables, inline_array, chunked_array_type, from_array_kwargs, backend_kwargs, **kwargs)
    675 decoders = _resolve_decoders_kwargs(
    676     decode_cf,
    677     open_backend_dataset_parameters=backend.open_dataset_parameters,
   (...)    683     decode_coords=decode_coords,
    684 )
    686 overwrite_encoded_chunks = kwargs.pop("overwrite_encoded_chunks", None)
--> 687 backend_ds = backend.open_dataset(
    688     filename_or_obj,
    689     drop_variables=drop_variables,
    690     **decoders,
    691     **kwargs,
    692 )
    693 ds = _dataset_from_backend_dataset(
    694     backend_ds,
    695     filename_or_obj,
   (...)    705     **kwargs,
    706 )
    707 return ds

File ~/micromamba/envs/geosmart-template/lib/python3.12/site-packages/xarray/backends/netCDF4_.py:666, in NetCDF4BackendEntrypoint.open_dataset(self, filename_or_obj, mask_and_scale, decode_times, concat_characters, decode_coords, drop_variables, use_cftime, decode_timedelta, group, mode, format, clobber, diskless, persist, auto_complex, lock, autoclose)
    644 def open_dataset(
    645     self,
    646     filename_or_obj: str | os.PathLike[Any] | ReadBuffer | AbstractDataStore,
   (...)    663     autoclose=False,
    664 ) -> Dataset:
    665     filename_or_obj = _normalize_path(filename_or_obj)
--> 666     store = NetCDF4DataStore.open(
    667         filename_or_obj,
    668         mode=mode,
    669         format=format,
    670         group=group,
    671         clobber=clobber,
    672         diskless=diskless,
    673         persist=persist,
    674         auto_complex=auto_complex,
    675         lock=lock,
    676         autoclose=autoclose,
    677     )
    679     store_entrypoint = StoreBackendEntrypoint()
    680     with close_on_error(store):

File ~/micromamba/envs/geosmart-template/lib/python3.12/site-packages/xarray/backends/netCDF4_.py:452, in NetCDF4DataStore.open(cls, filename, mode, format, group, clobber, diskless, persist, auto_complex, lock, lock_maker, autoclose)
    448     kwargs["auto_complex"] = auto_complex
    449 manager = CachingFileManager(
    450     netCDF4.Dataset, filename, mode=mode, kwargs=kwargs
    451 )
--> 452 return cls(manager, group=group, mode=mode, lock=lock, autoclose=autoclose)

File ~/micromamba/envs/geosmart-template/lib/python3.12/site-packages/xarray/backends/netCDF4_.py:393, in NetCDF4DataStore.__init__(self, manager, group, mode, lock, autoclose)
    391 self._group = group
    392 self._mode = mode
--> 393 self.format = self.ds.data_model
    394 self._filename = self.ds.filepath()
    395 self.is_remote = is_remote_uri(self._filename)

File ~/micromamba/envs/geosmart-template/lib/python3.12/site-packages/xarray/backends/netCDF4_.py:461, in NetCDF4DataStore.ds(self)
    459 @property
    460 def ds(self):
--> 461     return self._acquire()

File ~/micromamba/envs/geosmart-template/lib/python3.12/site-packages/xarray/backends/netCDF4_.py:455, in NetCDF4DataStore._acquire(self, needs_lock)
    454 def _acquire(self, needs_lock=True):
--> 455     with self._manager.acquire_context(needs_lock) as root:
    456         ds = _nc4_require_group(root, self._group, self._mode)
    457     return ds

File ~/micromamba/envs/geosmart-template/lib/python3.12/contextlib.py:137, in _GeneratorContextManager.__enter__(self)
    135 del self.args, self.kwds, self.func
    136 try:
--> 137     return next(self.gen)
    138 except StopIteration:
    139     raise RuntimeError("generator didn't yield") from None

File ~/micromamba/envs/geosmart-template/lib/python3.12/site-packages/xarray/backends/file_manager.py:199, in CachingFileManager.acquire_context(self, needs_lock)
    196 @contextlib.contextmanager
    197 def acquire_context(self, needs_lock=True):
    198     """Context manager for acquiring a file."""
--> 199     file, cached = self._acquire_with_cache_info(needs_lock)
    200     try:
    201         yield file

File ~/micromamba/envs/geosmart-template/lib/python3.12/site-packages/xarray/backends/file_manager.py:217, in CachingFileManager._acquire_with_cache_info(self, needs_lock)
    215     kwargs = kwargs.copy()
    216     kwargs["mode"] = self._mode
--> 217 file = self._opener(*self._args, **kwargs)
    218 if self._mode == "w":
    219     # ensure file doesn't get overridden when opened again
    220     self._mode = "a"

File src/netCDF4/_netCDF4.pyx:2521, in netCDF4._netCDF4.Dataset.__init__()

File src/netCDF4/_netCDF4.pyx:2158, in netCDF4._netCDF4._ensure_nc_success()

FileNotFoundError: [Errno 2] No such file or directory: '/home/runner/work/oceanography/oceanography/book/data/roms_osb_july_2021.nc'
print(s.w.long_name)
print(s.TIC.long_name)
vertical momentum component
total inorganic carbon
Coordinates:
lat_rho
lat_u
lat_v
lon_rho
lon_u
lon_v
ocean_time(ocean_time)                   Also a dimension
s_rho(s_rho)                             Also a dimension
s_w(s_w)                                 Also a dimension

In the following table an asterisk (*) means it could be comparable to shallow
profiler data.

Data variable                         ?  Guess or Solid Guess: Interpretation
AKs(ocean_time, s_rho)                   salinity vertical diffusion coefficient
AKv(ocean_time, s_rho)                   vertical viscosity coefficient
Cs_r(s_rho)                              model geometry stuff
Cs_w(s_w)                                model geometry stuff
Ldetritus(ocean_time, s_rho)          *  Ldetritus concentration
NO3(ocean_time, s_rho)                *  Nitrate: Cell centers
Pair(ocean_time)                         Surface air pressure
TIC(ocean_time, s_rho)                *  Total Inorganic Carbon: Cell centers
                                         Might relate to FDOM and backscatter
Uwind(ocean_time)                        Sea surface windspeed u-component
Vwind(ocean_time)                                              v-component
alkalinity(ocean_time, s_rho)         *  total alkalinity: Maybe compares with pH?
bustr(ocean_time)                        bottom stress (u)
bvstr(ocean_time)                                      (v)
detritus(ocean_time, s_rho)           *  Detritus concentration: Would relate to FDOM
h()                                      bathymetry
hc()                                     geometry-related
latent(ocean_time)                       net latent heat flux (presume through surface) watt m-2
lwrad(ocean_time)                     *  net longwave radiation flux
oxygen(ocean_time, s_rho)             *  Dissolved oxygen concentration: Cell centers
phytoplankton(ocean_time, s_rho)      *  Phytoplankton concentration: Cell centers
                                         Would relate to chlor-a
rho(ocean_time, s_rho)                *  Density anomaly
salt(ocean_time, s_rho)               *  Salinity
sensible(ocean_time)                     Net sensible heat flux
shflux(ocean_time)
ssflux(ocean_time)
sustr(ocean_time)
svstr(ocean_time)
swrad(ocean_time)                     *  Solar shortwave radiation flux
temp(ocean_time, s_rho)               *  Temperature
u(ocean_time, s_rho)                  *  u and v are momenta along grid axes
ubar(ocean_time)
v(ocean_time, s_rho)                  *
vbar(ocean_time)
w(ocean_time, s_w)
zeta(ocean_time)                         free surface
zooplankton(ocean_time, s_rho)        *  Zooplankton: Cell centers
z_rho(ocean_time, s_rho)                 Depths: Model cell center depths 'rho'
z_w(ocean_time, s_w)                     Depths: Model cell boundary depths 'w'
Time window#
Use the cell below to save out one-month blocks of data. This cuts the data volume.
# s=s.sel(ocean_time=slice(dt64('2021-07-01'), dt64('2021-08-01')))
# s.to_netcdf('roms_osb_july_2021.nc')
# getting out the 30 'rho' cell-center water column depths
#   negative down from 0; notice order is from seafloor to surface
time_index = 2700      # arbitrary
for i in [0, 1, 2, 3, 4, 25, 26, 27, 28, 29]:
    print(s.z_rho[17][i].data)
-2871.2412114824797
-2727.360262672962
-2569.4778341926476
-2401.0509919077144
-2225.7657492685216
-48.96414323677715
-29.653077317891825
-15.305969609559634
-5.735027623723722
-0.8148387586473073
Some notes on units#
s.shflux is surface net heat flux
s.swrad is solar shortwave radiation flux
s.zeta is free surface (height relative to mean)
s.NO3 is nitrate concentration (millimole_nitrogen meter-3)
s.phytoplankton is phytoplankton concentration (millimole_nitrogen meter-3)
s.rho is density anomaly (kg m-3)
s.salt is salinity (g kg-1)
# Modified version of Parker's code; key features:
# renamed Parker's T as 'Tpm' to avoid collisions
roms_datafile = '../data/roms_osb_july_2021.nc'
ds = xr.load_dataset(roms_datafile)
ot = ds.ocean_time.values
ot_dt = pd.to_datetime(ot)
t = (ot_dt - ot_dt[0]).total_seconds().to_numpy()
Tpm = t/86400 # time in days from start
print('time step of mooring'.center(60,'-'))
print(t[1])
print('time limits'.center(60,'-'))
print('start ' + str(ot_dt[0]))
print('end ' + str(ot_dt[-1]))
print('info'.center(60,'-'))
VN_list = []
for vn in ds.data_vars:
if not (vn == 'z_rho' or vn == 'z_w'):
vnlj = vn.ljust(20, ' ')
print('%s ( %s ) %s' % (vnlj, ds[vn].long_name, ds[vn].shape))
VN_list.append(vn)
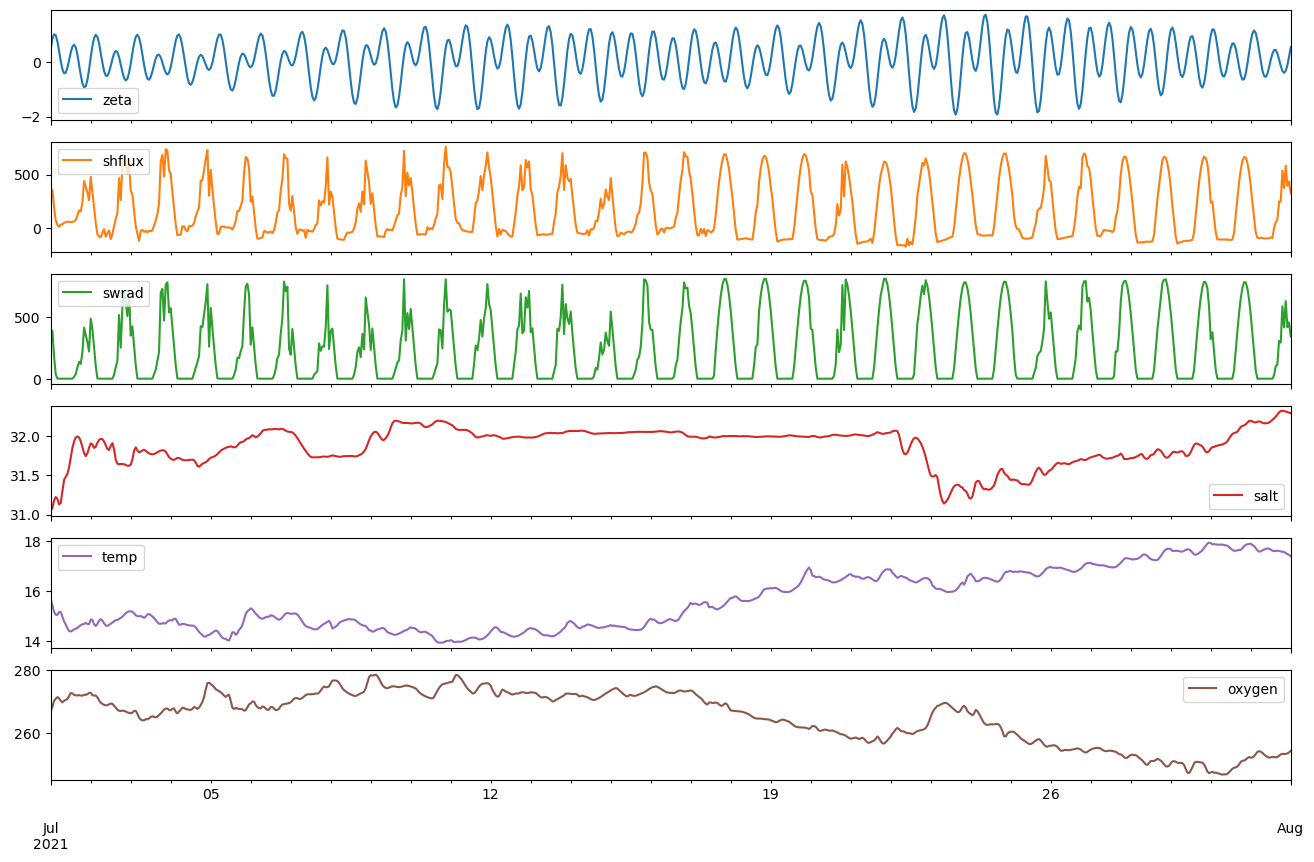
# populate lists of variables to plot
vn2_list = ['zeta']
if 'shflux' in VN_list:
vn2_list += ['shflux', 'swrad']
vn3_list = []
if 'salt' in VN_list:
vn3_list += ['salt', 'temp']
if 'oxygen' in VN_list:
vn3_list += ['oxygen']
# plot time series using a pandas DataFrame
df = pd.DataFrame(index=ot)
for vn in vn2_list:
df[vn] = ds[vn].values
for vn in vn3_list:
# the -1 means surface values (order 0...-1 is from seafloor to surface)
df[vn] = ds[vn][:, -1].values
plt.close('all')
df.plot(subplots=True, figsize=(16,10))
plt.show()
--------------------time step of mooring--------------------
3600.0
------------------------time limits-------------------------
start 2021-07-01 00:00:00
end   2021-08-01 00:00:00
----------------------------info----------------------------
AKs                  ( salinity vertical diffusion coefficient ) (745, 31)
AKv                  ( vertical viscosity coefficient ) (745, 31)
Cs_r                 ( S-coordinate stretching curves at RHO-points ) (30,)
Cs_w                 ( S-coordinate stretching curves at W-points ) (31,)
Ldetritus            ( Ldetritus concentration ) (745, 30)
NO3                  ( nitrate concentration ) (745, 30)
Pair                 ( surface air pressure ) (745,)
TIC                  ( total inorganic carbon ) (745, 30)
Uwind                ( surface u-wind component ) (745,)
Vwind                ( surface v-wind component ) (745,)
alkalinity           ( total alkalinity ) (745, 30)
bustr                ( bottom u-momentum stress ) (745,)
bvstr                ( bottom v-momentum stress ) (745,)
detritus             ( detritus concentration ) (745, 30)
h                    ( bathymetry at RHO-points ) ()
hc                   ( S-coordinate parameter, critical depth ) ()
latent               ( net latent heat flux ) (745,)
lwrad                ( net longwave radiation flux ) (745,)
oxygen               ( dissolved oxygen concentration ) (745, 30)
phytoplankton        ( phytoplankton concentration ) (745, 30)
rho                  ( density anomaly ) (745, 30)
salt                 ( salinity ) (745, 30)
sensible             ( net sensible heat flux ) (745,)
shflux               ( surface net heat flux ) (745,)
ssflux               ( surface net salt flux, (E-P)*SALT ) (745,)
sustr                ( surface u-momentum stress ) (745,)
svstr                ( surface v-momentum stress ) (745,)
swrad                ( solar shortwave radiation flux ) (745,)
temp                 ( potential temperature ) (745, 30)
u                    ( u-momentum component ) (745, 30)
ubar                 ( vertically integrated u-momentum component ) (745,)
v                    ( v-momentum component ) (745, 30)
vbar                 ( vertically integrated v-momentum component ) (745,)
w                    ( vertical momentum component ) (745, 31)
zeta                 ( free-surface ) (745,)
zooplankton          ( zooplankton concentration ) (745, 30)
Parker’s chart code#
Compressed a bit for space. Modified version is used above to produce those charts.
"""
Stand-alone code to plot a user-specified mooring extraction.
"""
from pathlib import Path
moor_fn = Path('...etcetera....nc')
import xarray as xr, matplotlib.pyplot as plt, pandas as pd, numpy as np

# load everything using xarray
ds = xr.load_dataset(moor_fn)
ot = ds.ocean_time.values
ot_dt = pd.to_datetime(ot)
t = (ot_dt - ot_dt[0]).total_seconds().to_numpy()
T = t/86400 # time in days from start
print('time step of mooring'.center(60,'-'))
print(t[1])
print('time limits'.center(60,'-'))
print('start ' + str(ot_dt[0]))
print('end   ' + str(ot_dt[-1]))
print('info'.center(60,'-'))
VN_list = []
for vn in ds.data_vars:
    print('%s %s' % (vn, ds[vn].shape))
    VN_list.append(vn)

# populate lists of variables to plot
vn2_list = ['zeta']
if 'shflux' in VN_list:
    vn2_list += ['shflux', 'swrad']
vn3_list = []
if 'salt' in VN_list:
    vn3_list += ['salt', 'temp']
if 'oxygen' in VN_list:
    vn3_list += ['oxygen']

# plot time series using a pandas DataFrame
df = pd.DataFrame(index=ot)
for vn in vn2_list:
    df[vn] = ds[vn].values
for vn in vn3_list:
    # the -1 means surface values
    df[vn] = ds[vn][:, -1].values

plt.close('all')
df.plot(subplots=True, figsize=(16,10))
plt.show()