Training and Testing Dataset Overview#
Introduction#
In the realm of environmental research and forecasting, access to reliable and comprehensive datasets is paramount. Four such indispensable sources are gridMET, AMSR, MODIS, and SNOTEL. Each dataset offers unique insights into various aspects of Earth’s climate and terrain, contributing significantly to our understanding of environmental dynamics. These datasets serve as the cornerstone for numerous applications, including weather forecasting, ecological modeling, and climate change research. In our snowcast_wormhole workflow, we leverage the richness of these datasets to enhance the accuracy and robustness. Let’s embark on a detailed exploration of these invaluable data sources.
gridMET Dataset#
Introduction#
gridMET is like having a weather wizard at your fingertips! It’s a dataset packed with daily high-spatial resolution (~4-km, 1/24th degree) surface meteorological data covering the contiguous US, spanning from 1979 up to yesterday. It even extends its reach to cover southern British Columbia in real-time products. This dataset provides vital insights into weather patterns, aiding various industries and scientific endeavors.
Insights#
It offers a fascinating glimpse into historical weather patterns, allowing users to delve as far back as 1979.
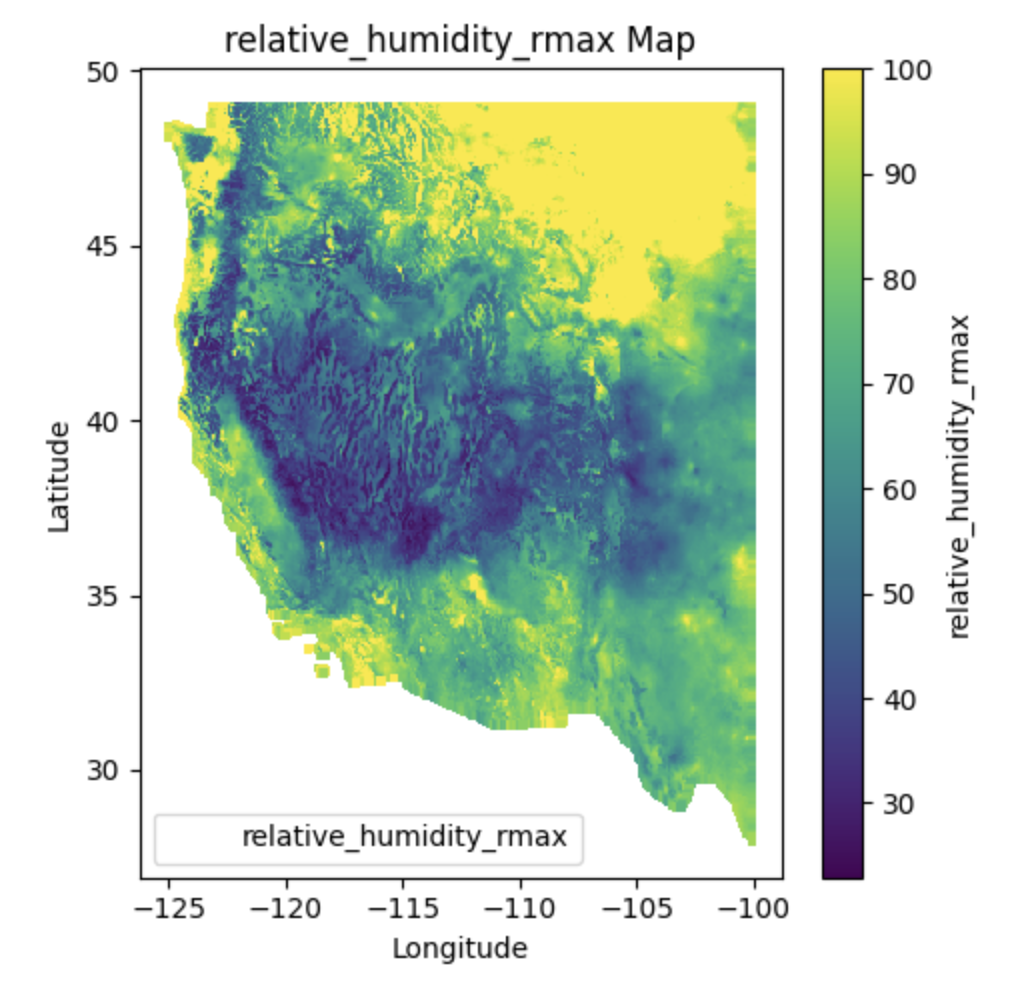
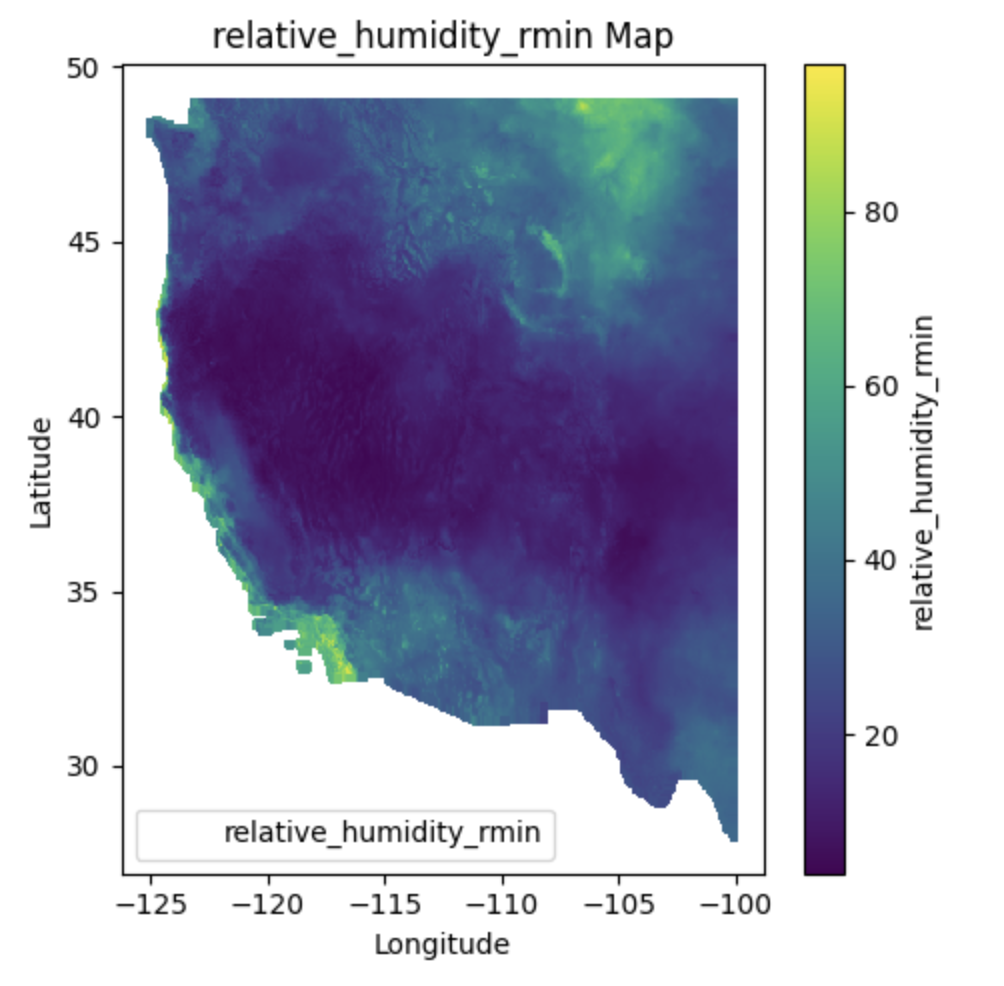
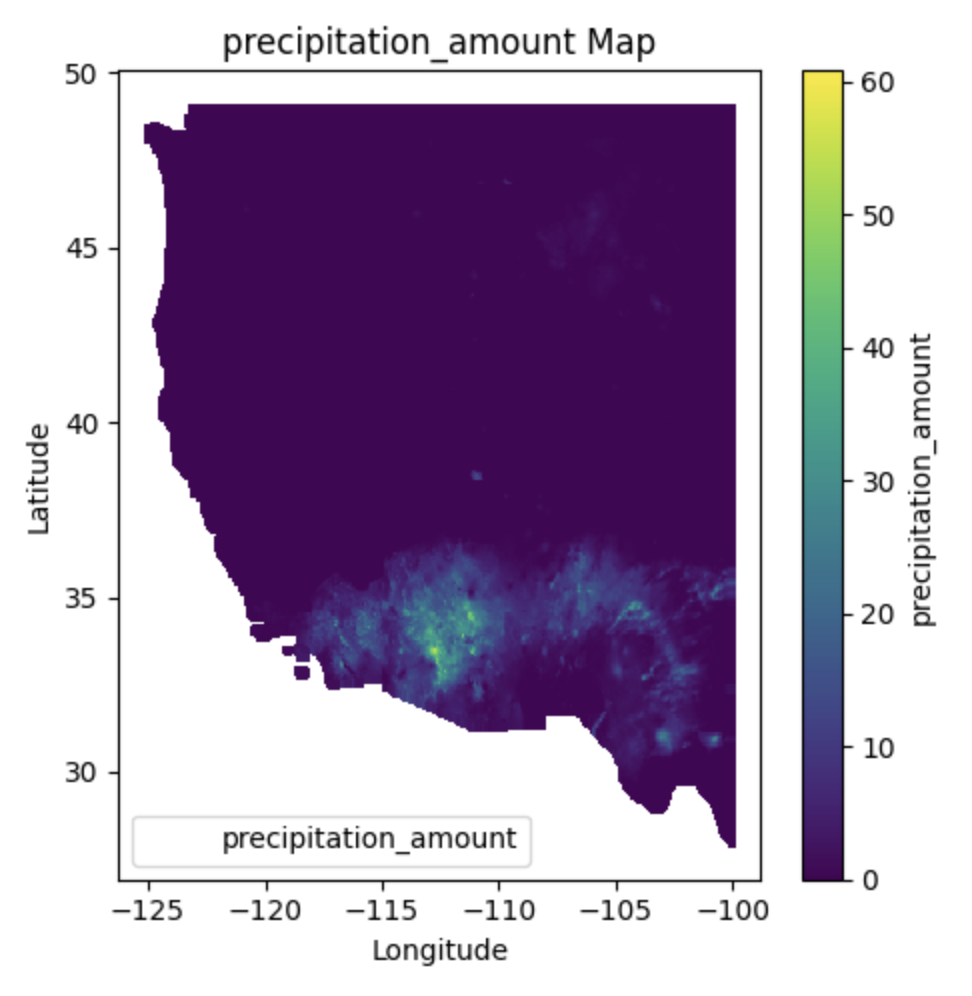
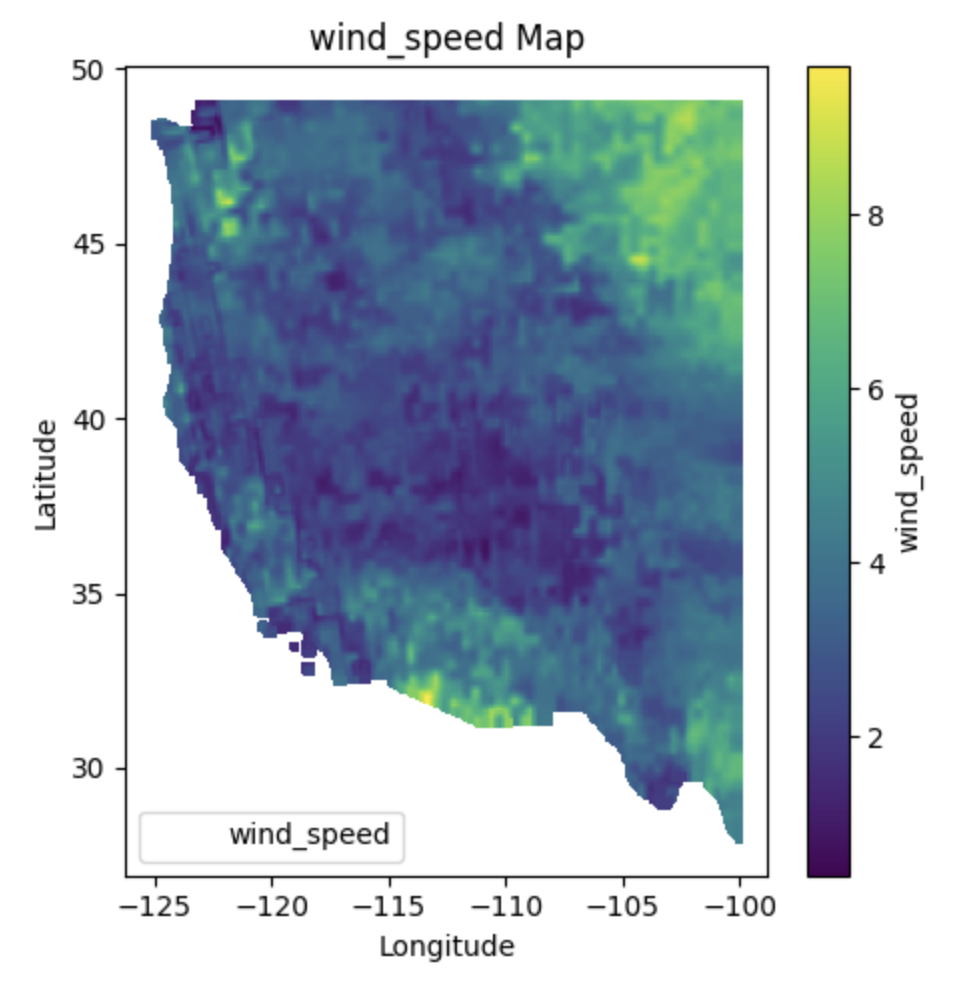
The dataset provides an extensive array of information, including maximum and minimum temperatures, precipitation, radiation, wind velocity, and various other meteorological variables.xx
Scientists and modelers find it invaluable for a myriad of purposes, such as ecological research, agricultural strategizing, hydrological modeling, and beyond.
Characteristics#
Spatial Resolution: GridMET provides data at a high spatial resolution, typically around 4 kilometers.
Temporal Resolution: The dataset offers data at a daily time step, allowing access to meteorological data for each day.
Variables: GridMET includes meteorological variables such as temperature, precipitation, humidity, wind speed, and solar radiation.
Coverage: The dataset covers the contiguous United States, providing comprehensive meteorological data for this region.
Quality: Data is derived from multiple sources including weather station observations, satellite data, and meteorological models, and is quality-controlled.
Long-term Availability: GridMET provides data spanning several decades, enabling analysis of historical meteorological trends and patterns.
Data Format:#
GRIDMET data is typically available in common file formats such as NetCDF (Network Common Data Form) or ASCII (plain text) format. NetCDF is widely used for multidimensional scientific data and provides efficient storage and access to large datasets. ASCII format offers simplicity and compatibility with various software tools for data analysis and visualization.
Data Sources and Acquisition:#
Satellite Data:#
GRIDMET utilizes satellite data from different sources such as the Geostationary Operational Environmental Satellite (GOES) and the Moderate Resolution Imaging Spectroradiometer (MODIS). These satellite observations provide valuable information on temperature, precipitation, humidity, and other atmospheric variables.
Ground-Based Observations:#
The dataset incorporates ground-based weather station observations from various networks such as the National Weather Service’s Cooperative Observer Program (COOP), the Automated Surface Observing System (ASOS), and the Automated Weather Data Network (AWDN). These observations help in validating and enhancing the accuracy of the dataset.
Meteorological Models:#
gridMET also integrates data from numerical weather prediction models like the North American Mesoscale Forecast System (NAM) and the Weather Research and Forecasting (WRF) model. These models provide forecasts and simulations of meteorological variables which are then blended with observed data to create a more complete dataset.
Applications:#
Climate research and modeling
Agriculture and crop management
Hydrology and water resource management
Renewable energy assessment
Disaster management and risk assessment
Ecological and environmental studies
For more details and updates on GridMET visit this page https://www.climatologylab.org/gridmet.html
gridMET Data Download:#
import os
import glob
import urllib.request
from datetime import date, datetime
import pandas as pd
import xarray as xr
from pathlib import Path
import warnings
#Chaging the timeframe to 1 year, instead of 10, for demonstration
train_start_date = "2020-01-03"
train_end_date = "2021-12-31"
homedir = os.path.expanduser('~')
work_dir = f"{homedir}/gridmet_test_run"
# Suppress FutureWarnings
warnings.filterwarnings("ignore", category=FutureWarning)
start_date = datetime.strptime(train_start_date, "%Y-%m-%d")
end_date = datetime.strptime(train_end_date, "%Y-%m-%d")
year_list = [start_date.year + i for i in range(end_date.year - start_date.year + 1)]
working_dir = work_dir
stations = pd.read_csv(f"{work_dir}/all_snotel_cdec_stations_active_in_westus.csv")
gridmet_save_location = f'{working_dir}/gridmet_climatology'
final_merged_csv = f"{work_dir}/training_all_active_snotel_station_list_elevation.csv_gridmet.csv"
def get_files_in_directory():
f = list()
for files in glob.glob(gridmet_save_location + "/*.nc"):
f.append(files)
return f
def download_file(url, save_location):
try:
print("download_file")
with urllib.request.urlopen(url) as response:
file_content = response.read()
file_name = os.path.basename(url)
save_path = os.path.join(save_location, file_name)
with open(save_path, 'wb') as file:
file.write(file_content)
print(f"File downloaded successfully and saved as: {save_path}")
except Exception as e:
print(f"An error occurred while downloading the file: {str(e)}")
def download_gridmet_climatology():
folder_name = gridmet_save_location
if not os.path.exists(folder_name):
os.makedirs(folder_name)
base_metadata_url = "http://www.northwestknowledge.net/metdata/data/"
variables_list = ['tmmn', 'tmmx', 'pr', 'vpd', 'etr', 'rmax', 'rmin', 'vs']
for var in variables_list:
for y in year_list:
download_link = base_metadata_url + var + '_' + '%s' % y + '.nc'
print("downloading", download_link)
if not os.path.exists(os.path.join(folder_name, var + '_' + '%s' % y + '.nc')):
download_file(download_link, folder_name)
def get_gridmet_variable(file_name):
print(f"reading values from {file_name}")
result_data = []
ds = xr.open_dataset(file_name)
var_to_extract = list(ds.keys())
print(var_to_extract)
var_name = var_to_extract[0]
df = pd.DataFrame(columns=['day', 'lat', 'lon', var_name])
csv_file = f'{gridmet_save_location}/{Path(file_name).stem}.csv'
if os.path.exists(csv_file):
print(f"The file '{csv_file}' exists.")
return
for idx, row in stations.iterrows():
lat = row['latitude']
lon = row['longitude']
subset_data = ds.sel(lat=lat, lon=lon, method='nearest')
subset_data['lat'] = lat
subset_data['lon'] = lon
converted_df = subset_data.to_dataframe()
converted_df = converted_df.reset_index(drop=False)
converted_df = converted_df.drop('crs', axis=1)
df = pd.concat([df, converted_df], ignore_index=True)
result_df = df
print("got result_df : ", result_df.head())
result_df.to_csv(csv_file, index=False)
print(f'completed extracting data for {file_name}')
def merge_similar_variables_from_different_years():
files = os.listdir(gridmet_save_location)
file_groups = {}
for filename in files:
base_name, year_ext = os.path.splitext(filename)
parts = base_name.split('_')
if len(parts) == 2 and year_ext == '.csv':
file_groups.setdefault(parts[0], []).append(filename)
for base_name, file_list in file_groups.items():
if len(file_list) > 1:
dfs = []
for filename in file_list:
df = pd.read_csv(os.path.join(gridmet_save_location, filename))
dfs.append(df)
merged_df = pd.concat(dfs, ignore_index=True)
merged_filename = f"{base_name}_merged.csv"
merged_df.to_csv(os.path.join(gridmet_save_location, merged_filename), index=False)
print(f"Merged {file_list} into {merged_filename}")
def merge_all_variables_together():
merged_df = None
file_paths = []
for filename in os.listdir(gridmet_save_location):
if filename.endswith("_merged.csv"):
file_paths.append(os.path.join(gridmet_save_location, filename))
rmin_merged_path = os.path.join(gridmet_save_location, 'rmin_merged.csv')
rmax_merged_path = os.path.join(gridmet_save_location, 'rmax_merged.csv')
tmmn_merged_path = os.path.join(gridmet_save_location, 'tmmn_merged.csv')
tmmx_merged_path = os.path.join(gridmet_save_location, 'tmmx_merged.csv')
df_rmin = pd.read_csv(rmin_merged_path)
df_rmax = pd.read_csv(rmax_merged_path)
df_tmmn = pd.read_csv(tmmn_merged_path)
df_tmmx = pd.read_csv(tmmx_merged_path)
df_rmin.rename(columns={'relative_humidity': 'relative_humidity_rmin'}, inplace=True)
df_rmax.rename(columns={'relative_humidity': 'relative_humidity_rmax'}, inplace=True)
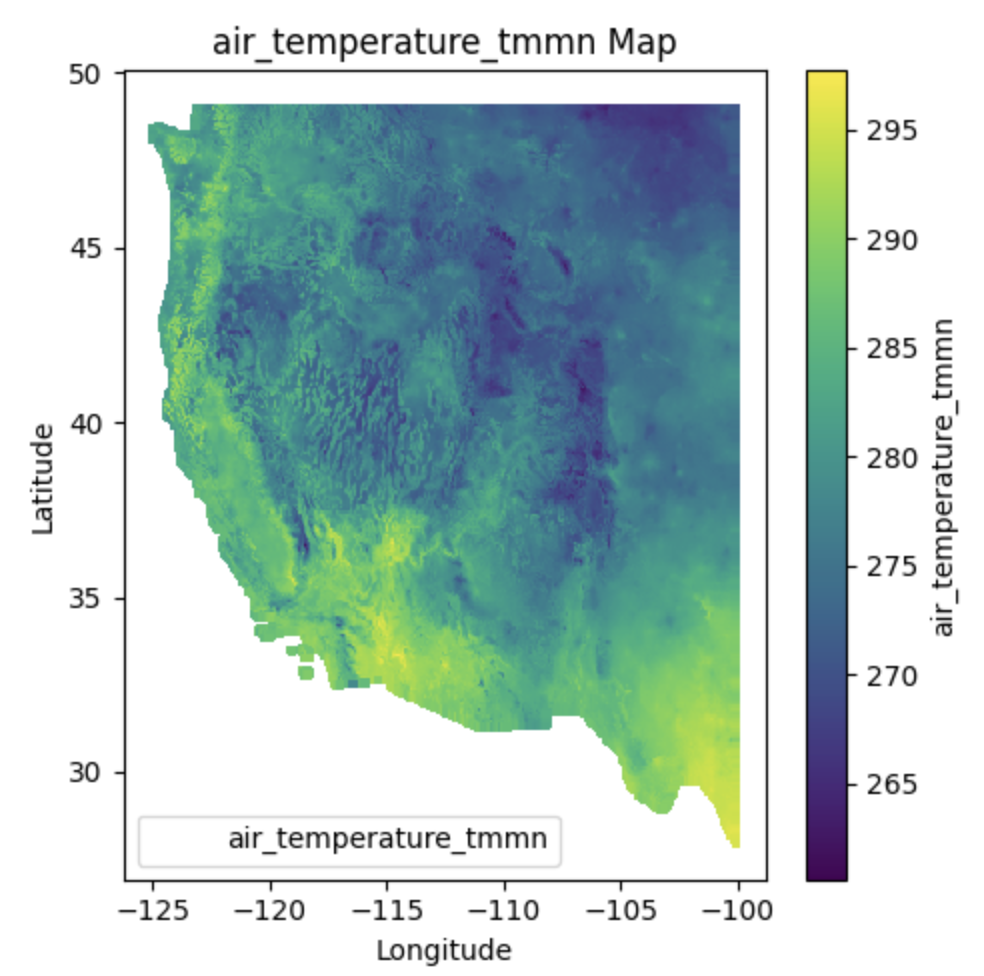
df_tmmn.rename(columns={'air_temperature': 'air_temperature_tmmn'}, inplace=True)
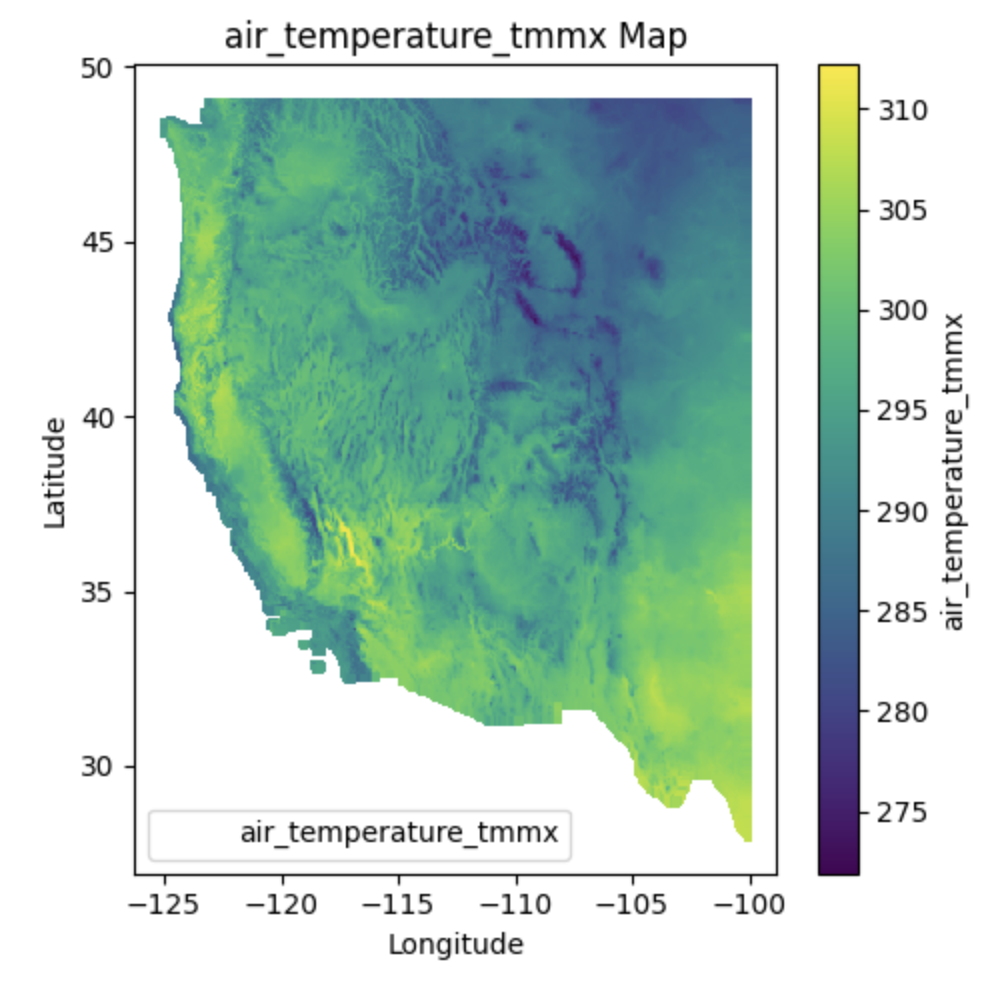
df_tmmx.rename(columns={'air_temperature': 'air_temperature_tmmx'}, inplace=True)
df_rmin.to_csv(os.path.join(gridmet_save_location, 'rmin_merged.csv'))
df_rmax.to_csv(os.path.join(gridmet_save_location, 'rmax_merged.csv'))
df_tmmn.to_csv(os.path.join(gridmet_save_location, 'tmmn_merged.csv'))
df_tmmx.to_csv(os.path.join(gridmet_save_location, 'tmmx_merged.csv'))
if file_paths:
merged_df = pd.read_csv(file_paths[0])
for file_path in file_paths[1:]:
df = pd.read_csv(file_path)
merged_df = pd.concat([merged_df, df], axis=1)
merged_df = merged_df.loc[:, ~merged_df.columns.duplicated()]
merged_df.to_csv(final_merged_csv, index=False)
if __name__ == "__main__":
download_gridmet_climatology()
nc_files = get_files_in_directory()
for nc in nc_files:
get_gridmet_variable(nc)
merge_similar_variables_from_different_years()
merge_all_variables_together()
downloading http://www.northwestknowledge.net/metdata/data/tmmn_2020.nc
downloading http://www.northwestknowledge.net/metdata/data/tmmn_2021.nc
downloading http://www.northwestknowledge.net/metdata/data/tmmx_2020.nc
downloading http://www.northwestknowledge.net/metdata/data/tmmx_2021.nc
downloading http://www.northwestknowledge.net/metdata/data/pr_2020.nc
downloading http://www.northwestknowledge.net/metdata/data/pr_2021.nc
downloading http://www.northwestknowledge.net/metdata/data/vpd_2020.nc
downloading http://www.northwestknowledge.net/metdata/data/vpd_2021.nc
downloading http://www.northwestknowledge.net/metdata/data/etr_2020.nc
downloading http://www.northwestknowledge.net/metdata/data/etr_2021.nc
downloading http://www.northwestknowledge.net/metdata/data/rmax_2020.nc
downloading http://www.northwestknowledge.net/metdata/data/rmax_2021.nc
downloading http://www.northwestknowledge.net/metdata/data/rmin_2020.nc
downloading http://www.northwestknowledge.net/metdata/data/rmin_2021.nc
downloading http://www.northwestknowledge.net/metdata/data/vs_2020.nc
downloading http://www.northwestknowledge.net/metdata/data/vs_2021.nc
reading values from /Users/meghana/gridmet_test_run/gridmet_climatology/rmin_2021.nc
['relative_humidity']
The file '/Users/meghana/gridmet_test_run/gridmet_climatology/rmin_2021.csv' exists.
reading values from /Users/meghana/gridmet_test_run/gridmet_climatology/tmmn_2021.nc
['air_temperature']
The file '/Users/meghana/gridmet_test_run/gridmet_climatology/tmmn_2021.csv' exists.
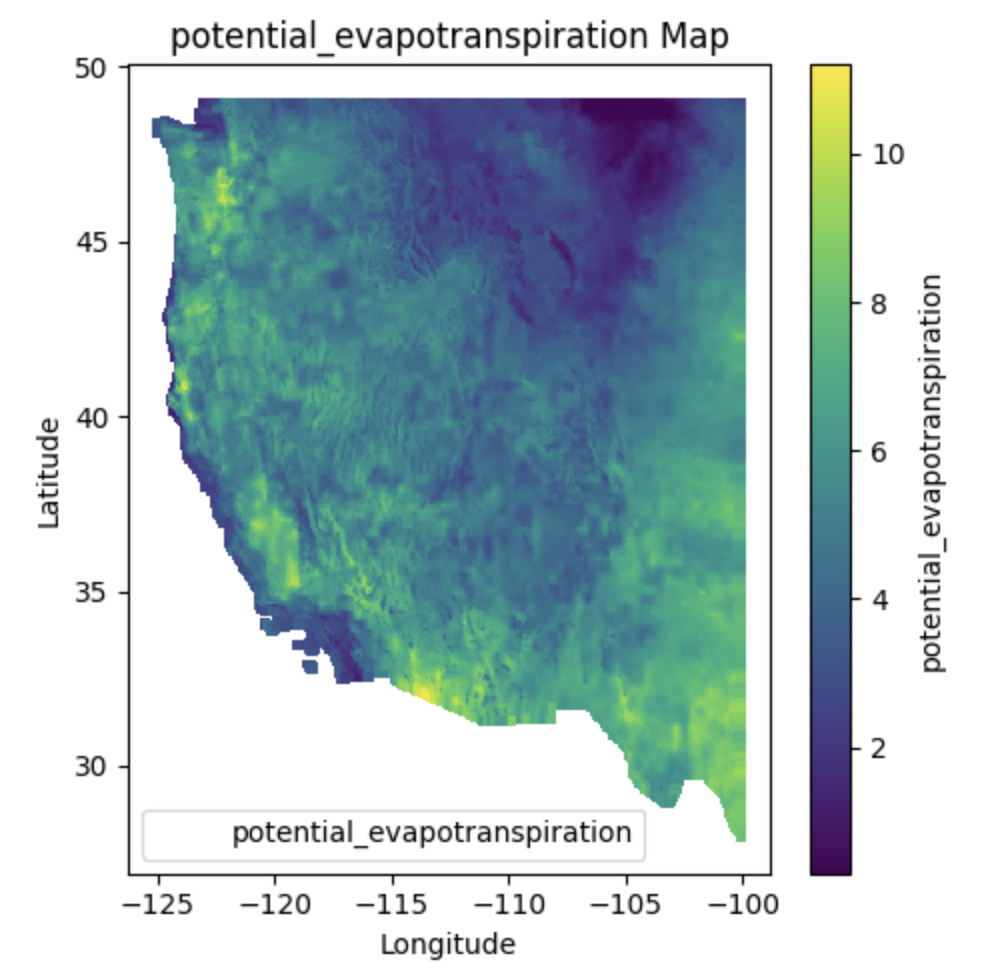
reading values from /Users/meghana/gridmet_test_run/gridmet_climatology/etr_2021.nc
['potential_evapotranspiration']
The file '/Users/meghana/gridmet_test_run/gridmet_climatology/etr_2021.csv' exists.
reading values from /Users/meghana/gridmet_test_run/gridmet_climatology/etr_2020.nc
['potential_evapotranspiration']
The file '/Users/meghana/gridmet_test_run/gridmet_climatology/etr_2020.csv' exists.
reading values from /Users/meghana/gridmet_test_run/gridmet_climatology/rmin_2020.nc
['relative_humidity']
The file '/Users/meghana/gridmet_test_run/gridmet_climatology/rmin_2020.csv' exists.
reading values from /Users/meghana/gridmet_test_run/gridmet_climatology/tmmn_2020.nc
['air_temperature']
The file '/Users/meghana/gridmet_test_run/gridmet_climatology/tmmn_2020.csv' exists.
reading values from /Users/meghana/gridmet_test_run/gridmet_climatology/tmmx_2021.nc
['air_temperature']
The file '/Users/meghana/gridmet_test_run/gridmet_climatology/tmmx_2021.csv' exists.
reading values from /Users/meghana/gridmet_test_run/gridmet_climatology/tmmx_2020.nc
['air_temperature']
The file '/Users/meghana/gridmet_test_run/gridmet_climatology/tmmx_2020.csv' exists.
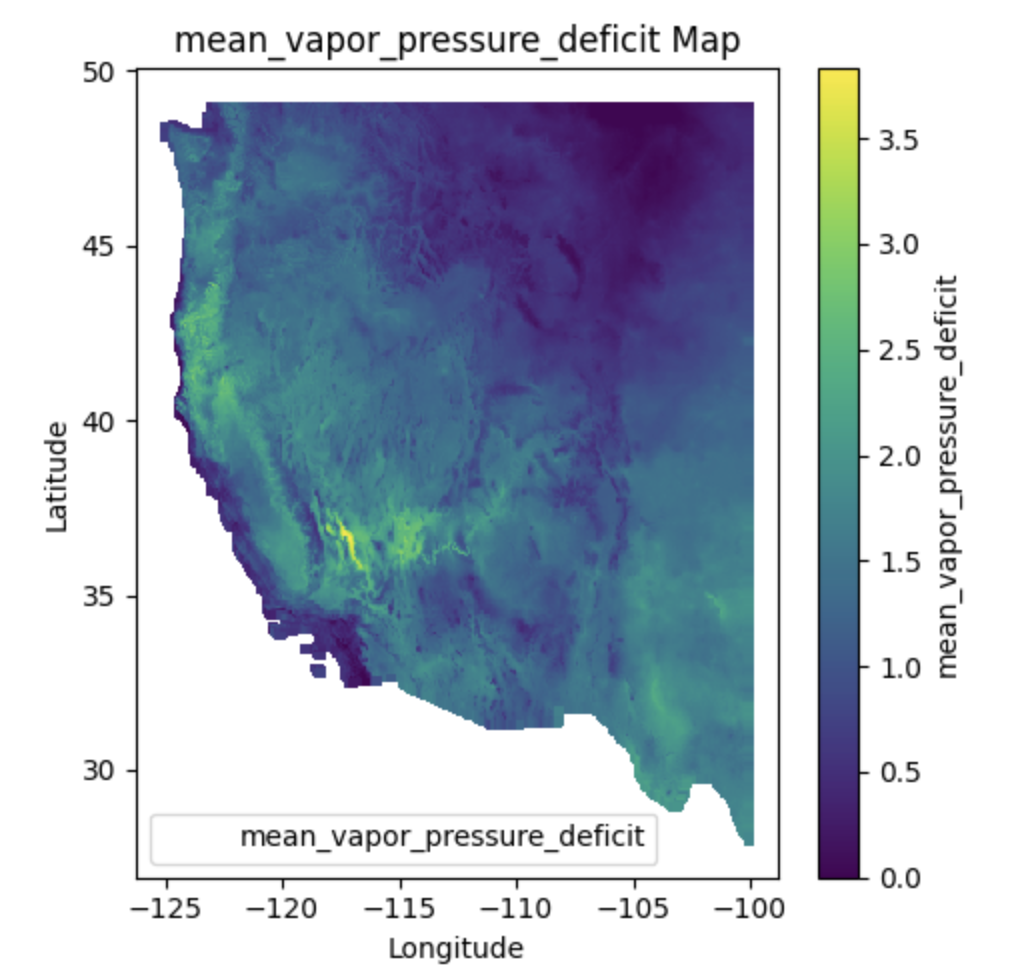
reading values from /Users/meghana/gridmet_test_run/gridmet_climatology/vpd_2020.nc
['mean_vapor_pressure_deficit']
The file '/Users/meghana/gridmet_test_run/gridmet_climatology/vpd_2020.csv' exists.
reading values from /Users/meghana/gridmet_test_run/gridmet_climatology/pr_2021.nc
['precipitation_amount']
The file '/Users/meghana/gridmet_test_run/gridmet_climatology/pr_2021.csv' exists.
reading values from /Users/meghana/gridmet_test_run/gridmet_climatology/pr_2020.nc
['precipitation_amount']
The file '/Users/meghana/gridmet_test_run/gridmet_climatology/pr_2020.csv' exists.
reading values from /Users/meghana/gridmet_test_run/gridmet_climatology/vpd_2021.nc
['mean_vapor_pressure_deficit']
The file '/Users/meghana/gridmet_test_run/gridmet_climatology/vpd_2021.csv' exists.
reading values from /Users/meghana/gridmet_test_run/gridmet_climatology/vs_2021.nc
['wind_speed']
The file '/Users/meghana/gridmet_test_run/gridmet_climatology/vs_2021.csv' exists.
reading values from /Users/meghana/gridmet_test_run/gridmet_climatology/rmax_2020.nc
['relative_humidity']
The file '/Users/meghana/gridmet_test_run/gridmet_climatology/rmax_2020.csv' exists.
reading values from /Users/meghana/gridmet_test_run/gridmet_climatology/vs_2020.nc
['wind_speed']
The file '/Users/meghana/gridmet_test_run/gridmet_climatology/vs_2020.csv' exists.
reading values from /Users/meghana/gridmet_test_run/gridmet_climatology/rmax_2021.nc
['relative_humidity']
The file '/Users/meghana/gridmet_test_run/gridmet_climatology/rmax_2021.csv' exists.
Merged ['tmmn_2020.csv', 'tmmn_2021.csv', 'tmmn_merged.csv'] into tmmn_merged.csv
Merged ['vs_merged.csv', 'vs_2020.csv', 'vs_2021.csv'] into vs_merged.csv
Merged ['rmax_merged.csv', 'rmax_2020.csv', 'rmax_2021.csv'] into rmax_merged.csv
Merged ['etr_merged.csv', 'etr_2020.csv', 'etr_2021.csv'] into etr_merged.csv
Merged ['vpd_merged.csv', 'vpd_2020.csv', 'vpd_2021.csv'] into vpd_merged.csv
Merged ['tmmx_2021.csv', 'tmmx_2020.csv', 'tmmx_merged.csv'] into tmmx_merged.csv
Merged ['pr_2021.csv', 'pr_2020.csv', 'pr_merged.csv'] into pr_merged.csv
Merged ['rmin_2021.csv', 'rmin_merged.csv', 'rmin_2020.csv'] into rmin_merged.csv
We acquire and consolidate GridMET climate data. Initially, we download GridMET climate data files for specified variables and years, ensuring comprehensive coverage. Subsequently, we extract data for each station from these files and organize it into CSV format, simplifying data handling. Additionally, we intelligently merge similar variables from different years, streamlining data aggregation. Ultimately, we combine all variables into a unified dataset, facilitating seamless analysis or modeling tasks. This automation enhances efficiency and accuracy in climate data processing, benefiting various research or environmental applications.
AMSR Dataset#
Introduction#
What is AMSR?#
AMSR, short for Advanced Microwave Scanning Radiometer is a satellite-based instrument designed to measure microwave emissions from the Earth’s surface and atmosphere. The AMSR dataset encompasses satellite-derived microwave observations crucial for a myriad of applications including weather forecasting, climate monitoring, and environmental studies. These datasets provide valuable insights into geophysical parameters such as sea surface temperature, soil moisture, sea ice concentration, precipitation, and wind speed over oceans. By collecting data on these factors, AMSR helps scientists better understand how water moves and behaves across the planet. Its observations provide valuable insights into Earth’s climate dynamics and hydrological processes, contributing to our overall understanding of the environment.
Quick Look at the Data Collections#
AMSR-E, or the Advanced Microwave Scanning Radiometer for the Earth Observing System, is like a high-tech detective tool that travels on NASA’s Aqua satellite. It gathers information about water on Earth and other important details about our environment. AMSR-E data collections include AMSR/ADEOS-II and AMSR2, hosted by the National Snow and Ice Data Center Distributed Active Archive Center (NSIDC DAAC). These datasets provide a treasure trove of polar observations, facilitating research in climatology, oceanography, hydrology, and more.
Characteristics#
Spatial Resolution: AMSR provides data at various spatial resolutions depending on the specific instrument version and product. Typically, it offers moderate to high spatial resolution microwave data.
Temporal Resolution: AMSR data is available at various temporal resolutions, ranging from daily to monthly, depending on the specific product and parameters.
Variables: AMSR measures various parameters such as soil moisture, sea surface temperature, precipitation, snow water equivalent, and sea ice concentration using microwave radiometry.
Coverage: AMSR provides global coverage, allowing for the monitoring of environmental parameters across different regions of the Earth.
Quality: Data from AMSR undergoes rigorous quality control processes to ensure accuracy and reliability, considering factors such as calibration and validation against ground-based measurements.
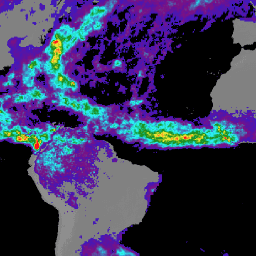
AMSR from TRMM 3B43V7 dataset
Data Format#
The Advanced Microwave Scanning Radiometer (AMSR) data is commonly stored in HDF5 format, providing a hierarchical structure for organizing datasets such as brightness temperature, sea surface temperature, and soil moisture. Within the HDF5 file, data parameters are organized into groups, with subgroups representing different configurations or subsets of the data. Metadata and geolocation information are typically stored separately, offering additional details about the data.
AMSR Data Collections#
AMSR/ADEOS-II#
AMS/ADEOS-II, operating on the Advanced Earth Observing Satellite-II (ADEOS-II) platform, was the initial version of the AMSR instrument, providing passive microwave measurements from early 2003 to October 24, 2003. Offering Level-1A and Level-2A products, it served as a crucial tool for studying changes in polar ice caps, global precipitation patterns, and oceanic circulation. This data has been instrumental in enhancing our understanding of Earth’s climate dynamics and informing research across various scientific disciplines.
AMSR2#
AMSR2, launched in 2012 onboard the Global Change Observation Mission-Water (GCOM-W1) satellite, represents the next generation of AMSR instruments. It continues the legacy of AMSR-E, capturing observations with improved spatial resolution and enhanced capabilities. AMSR2 data has been instrumental in monitoring sea ice extent, ocean surface winds, and soil moisture dynamics at global scales.
Hosted by NSIDC DAAC#
The NSIDC DAAC serves as the primary repository for AMSR-related data, ensuring that these valuable datasets are freely accessible to the scientific community and the public. The center provides data discovery, access, and user support services, facilitating research in cryospheric and hydrological sciences, climate modeling, and environmental monitoring.
Applications#
Weather Forecasting: AMSR data aids in short-term weather forecasting by providing insights into atmospheric moisture content and precipitation patterns.
Climate Monitoring: AMSR datasets contribute to long-term climate monitoring efforts by providing data on parameters like sea surface temperature and sea ice concentration.
Oceanography: AMSR data enables the study of ocean surface properties such as sea surface temperature, wind speed, and ocean salinity, facilitating research in oceanography and marine science.
Hydrology: AMSR-derived soil moisture data supports hydrological modeling, drought monitoring, and water resource management by providing information on soil moisture content and surface water availability.
Cryosphere Studies: AMSR datasets are crucial for studying the cryosphere, including monitoring changes in snow cover extent, snow water equivalent, and sea ice concentration, contributing to our understanding of climate change impacts in polar regions.
AMSR Dataset Download#
from datetime import datetime, timedelta
import os

def generate_links(start_year, end_year):
    '''
    Generate a list of download links for AMSR daily snow data files.

    Args:
        start_year (int): The starting year.
        end_year (int): The ending year (inclusive).

    Returns:
        list: A list of download links for AMSR daily snow data files.
    '''
    base_url = "https://n5eil01u.ecs.nsidc.org/AMSA/AU_DySno.001/"
    date_format = "%Y.%m.%d"
    delta = timedelta(days=1)

    start_date = datetime(start_year, 1, 1)
    end_date = datetime(end_year + 1, 1, 1)

    links = []
    current_date = start_date

    while current_date < end_date:
        date_str = current_date.strftime(date_format)
        link = base_url + date_str + "/AMSR_U2_L3_DailySnow_B02_" + date_str + ".he5"
        links.append(link)
        current_date += delta

    return links

if __name__ == "__main__":
    start_year = 2019
    end_year = 2022

    links = generate_links(start_year, end_year)
    homedir = os.path.expanduser('~')
    working_dir = f"{homedir}/gridmet_test_run"
    with open(f"{working_dir}/amsr/download_links.txt", "w") as txt_file:
      for l in links:
        txt_file.write(" ".join(l) + "\n")
MODIS Dataset#
What is MODIS?#
MODIS, which stands for MODerate Resolution Imaging Spectroradiometer, is an advanced instrument operating aboard both the Terra and Aqua spacecraft. It captures a comprehensive view of Earth’s surface, oceans, and atmosphere. The MODIS dataset is a comprehensive collection of Earth observation data captured by the MODIS instruments. Scientists use MODIS data to track changes in things like land cover, weather patterns, ice and snow, and the color of the oceans. MODIS boasts a remarkable viewing swath width of 2,330 km and covers the entire Earth surface every one to two days. With 36 spectral bands ranging from 0.405 to 14.385 µm, it provides detailed data at three spatial resolutions: 250m, 500m, and 1,000m.
Characteristics#
Earth Science Data Type (ESDT): MOD10A1
Product Level: L3
Nominal Data Array Dimensions: 1200km by 1200km
Spatial Resolution: 500m
Temporal Resolution: day
Map Projection: Sinusoidal
Data Format#
MODIS data are typically available in Hierarchical Data Format (HDF) or NetCDF formats, which are widely used for storing and distributing Earth observation data. These formats facilitate efficient data access, manipulation, and analysis using various software tools and programming languages commonly employed in the Earth sciences community.
MODIS Direct Broadcast#
Users with x-band receiving systems can capture regional data directly from the spacecraft using the MODIS Direct Broadcast signal, enhancing real-time monitoring capabilities.
fSCA#
Fractional Snow Covered Area (fSCA) is a metric used in the field of snow science and environmental studies to quantify the proportion of a given area that is covered by snow. It is derived from remote sensing data, particularly from sensors like Landsat, which capture images of the Earth’s surface in various spectral bands. By analyzing these images, researchers can differentiate between snow-covered and snow-free areas, allowing them to calculate the percentage of the landscape covered by snow at a particular point in time. fSCA is valuable for understanding snow distribution patterns, monitoring changes in snow cover over time, and aiding in snowmelt and water resource management. It plays a crucial role in snowpack modeling, avalanche forecasting, and climate change research, providing essential data for informing decision-making processes related to snow-dependent ecosystems and human activities.
SNOTEL dataset#
What is SNOTEL?#
The SNOwpackTELemetryNetwork (SNOTEL) is an automated system of snowpack and climate sensors managed by the Natural Resources Conservation Service (NRCS) in the Western United States, offering critical data for water supply forecasting, flood prediction, and climate research. SNOTEL provides real-time data on snow water equivalent, snow depth, precipitation, and temperature from remote mountainous regions, aiding in understanding hydroclimatic conditions. SNOTEL offers comprehensive snowpack and climate data from over 900 sites, helping monitor snowpack, precipitation, temperature, and other climatic conditions in the western U.S.The SNOTEL dataset serves as a valuable resource for a wide range of stakeholders, contributing to informed decision-making in various sectors impacted by snowpack and climate conditions.
SNOTEL Network Overview#
Composition of SNOTEL#
Comprising over 900 automated sites in remote, high-elevation mountain watersheds.
Monitors snowpack, precipitation, temperature, and other climatic parameters.
Operations and Data Collection#
Sites operate unattended and without maintenance for extended periods.
Standard sensor configuration includes snow pillow, precipitation gauge, and temperature sensors.
Telemetry and Data Transmission#
Data Collection and Storage#
Dataloggers installed in equipment shelters collect and store data.
Various telemetry systems transmit data back to the Water and Climate Information System.
Enhanced Site Capabilities#
Enhanced sites equipped with soil moisture, soil temperature, solar radiation, wind speed, and relative humidity sensors.
Tailored configurations based on physical conditions and climate requirements.
Characteristics#
Product/Data Type: SNOTEL Station Daily Data
Spatial Resolution: Point data specific to each SNOTEL station location present in the western USA within bounding box of southwest_lon = -125.0 southwest_lat = 25.0 northeast_lon = -100.0 northeast_lat = 49.0
Temporal Resolution: Daily
Quality: SNOTEL data undergoes quality control procedures to ensure accuracy and reliability, including calibration checks and validation against manual measurements.
Data Format#
The Snow Telemetry (SNOTEL) data format encompasses structured datasets collected from remote automated stations situated in mountainous regions, monitoring snowpack, weather, and hydrological parameters. Key aspects include recorded parameters such as snow water equivalent (SWE), snow depth, air temperature, and precipitation, timestamped to denote observation times and often stored at varying resolutions like hourly or daily intervals. Quality control flags accompany data points to denote reliability, while metadata provides station details and sensor calibration information. SNOTEL data is commonly stored in formats like CSV, TSV, HDF5, or netCDF, accessible through agency websites, data portals, or APIs. This format facilitates applications spanning water resource management, climate research, agriculture, recreation, hydrological modeling, and ecological studies.
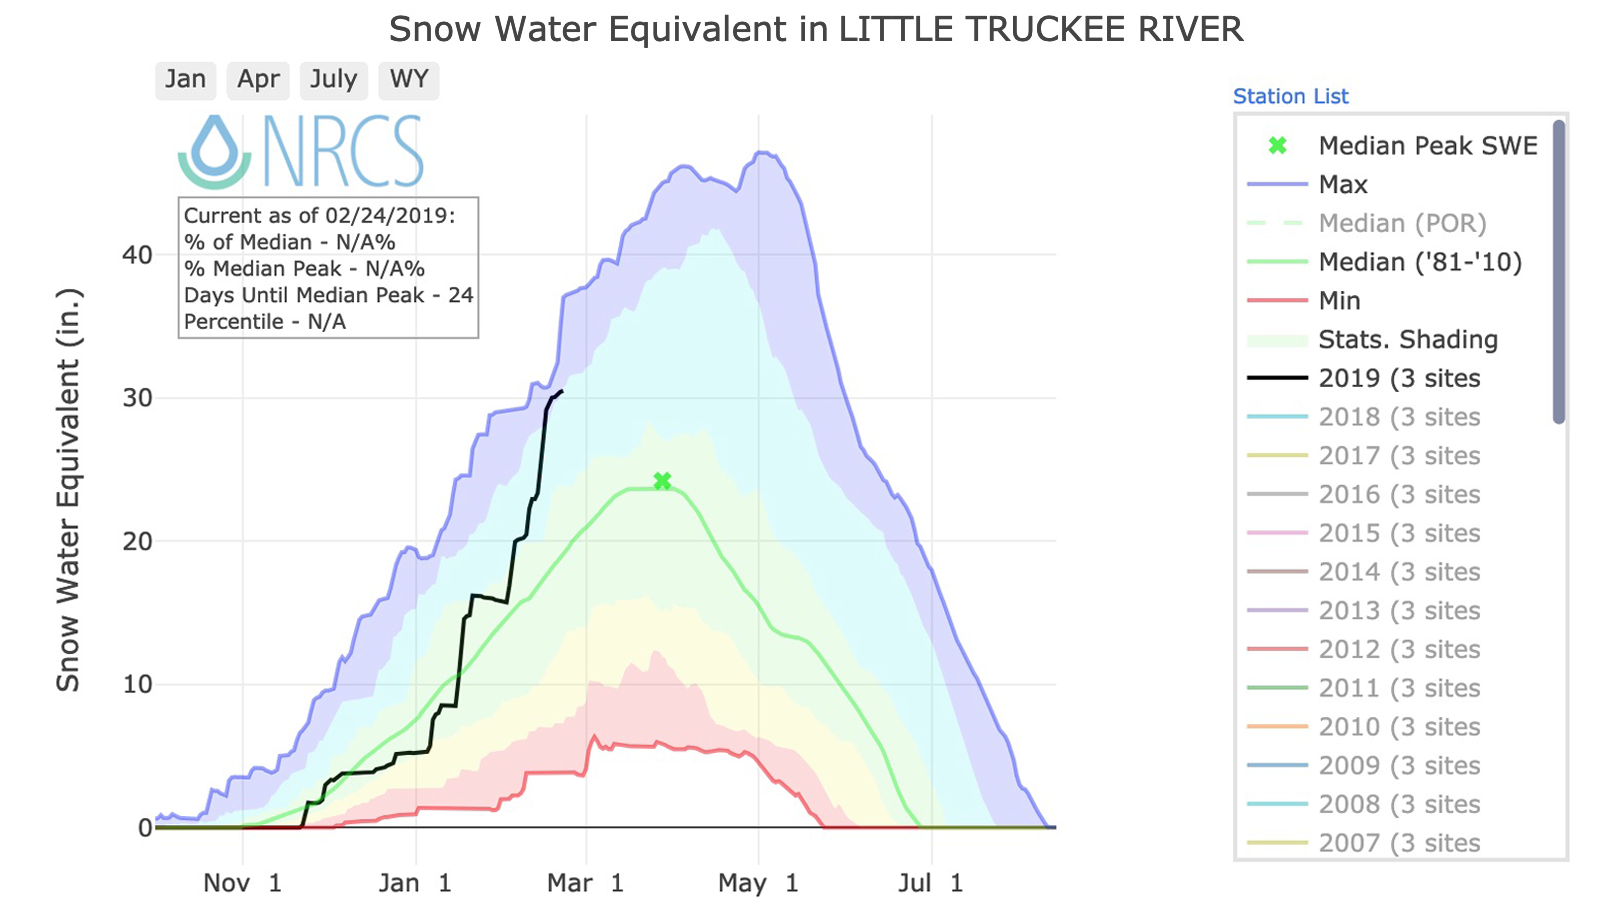
Snow Water Equivalent in Western Basins
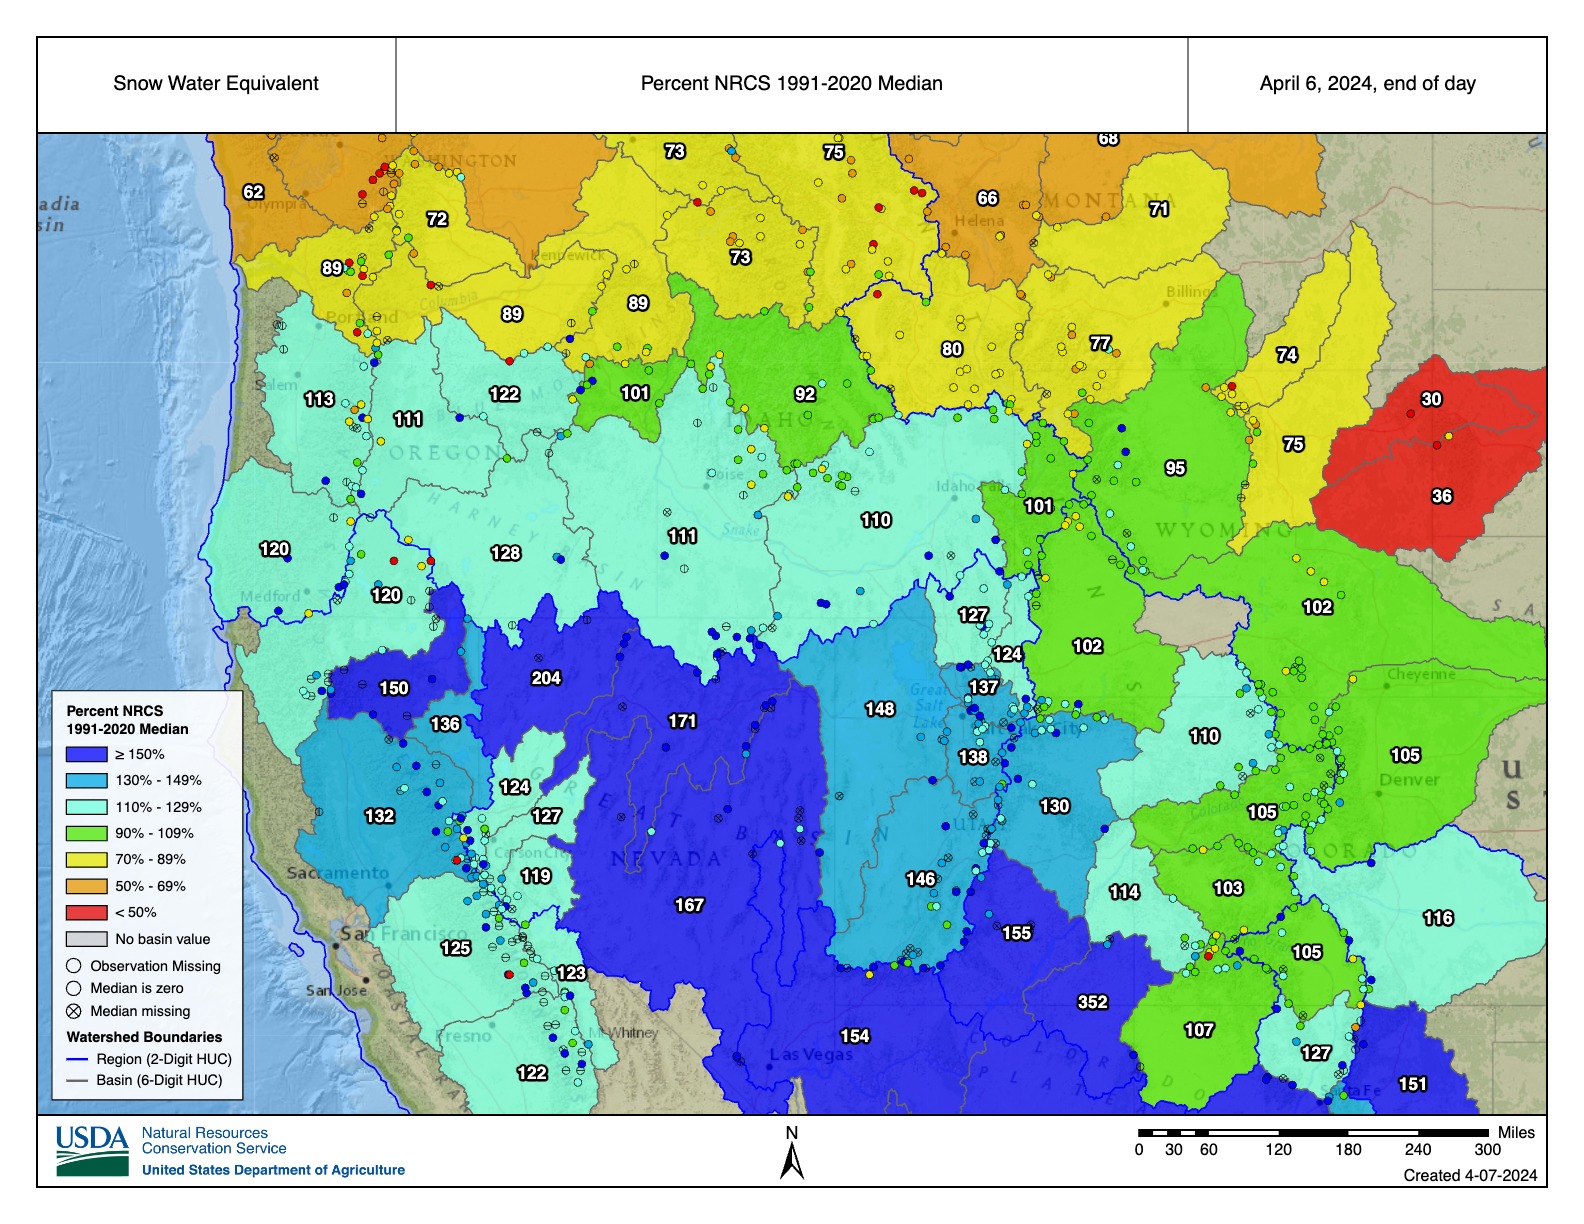
Snow Water Equivalent Percent NRCS 1991-2020 Median April 6 2024
For map visualization of SNOWTEL stations, click on ‘SNOWTEL data’ under ‘Climate Monitoring’ in the right panel. The maps are clickable for station selection.
For more information, visit the NRCS SNOTEL page.
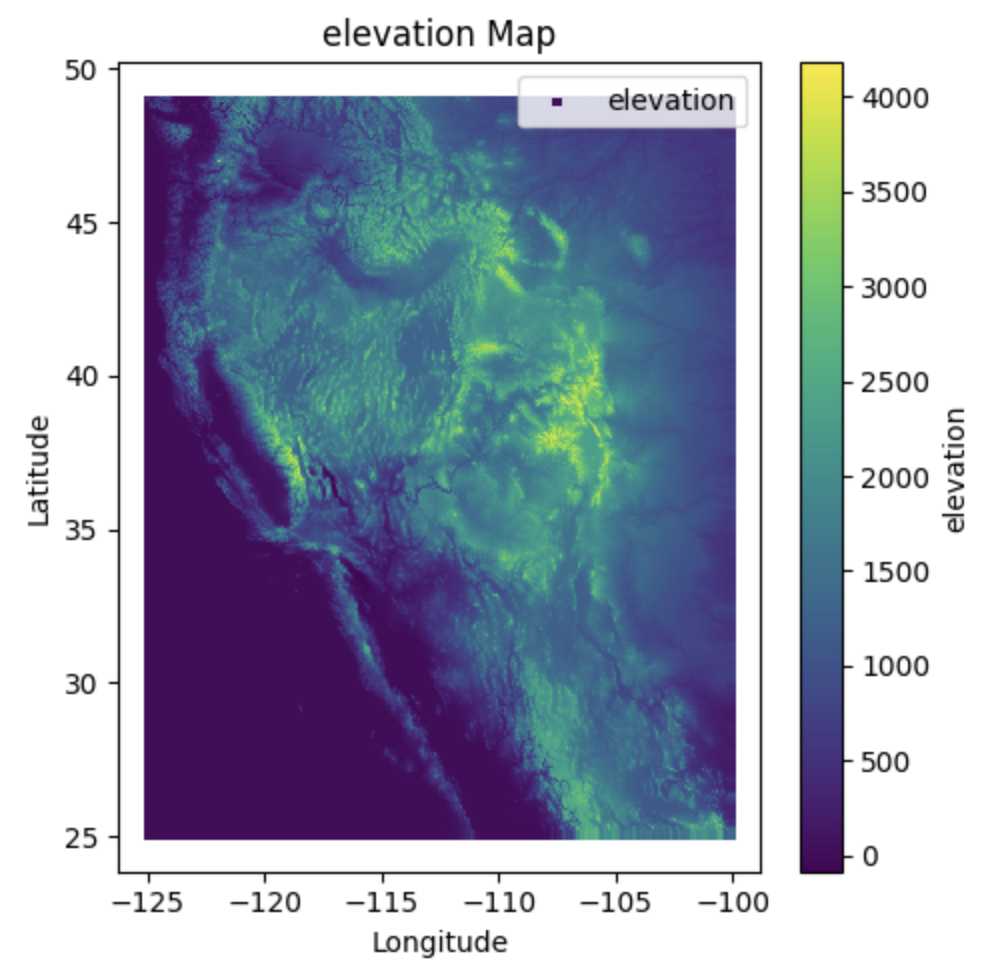
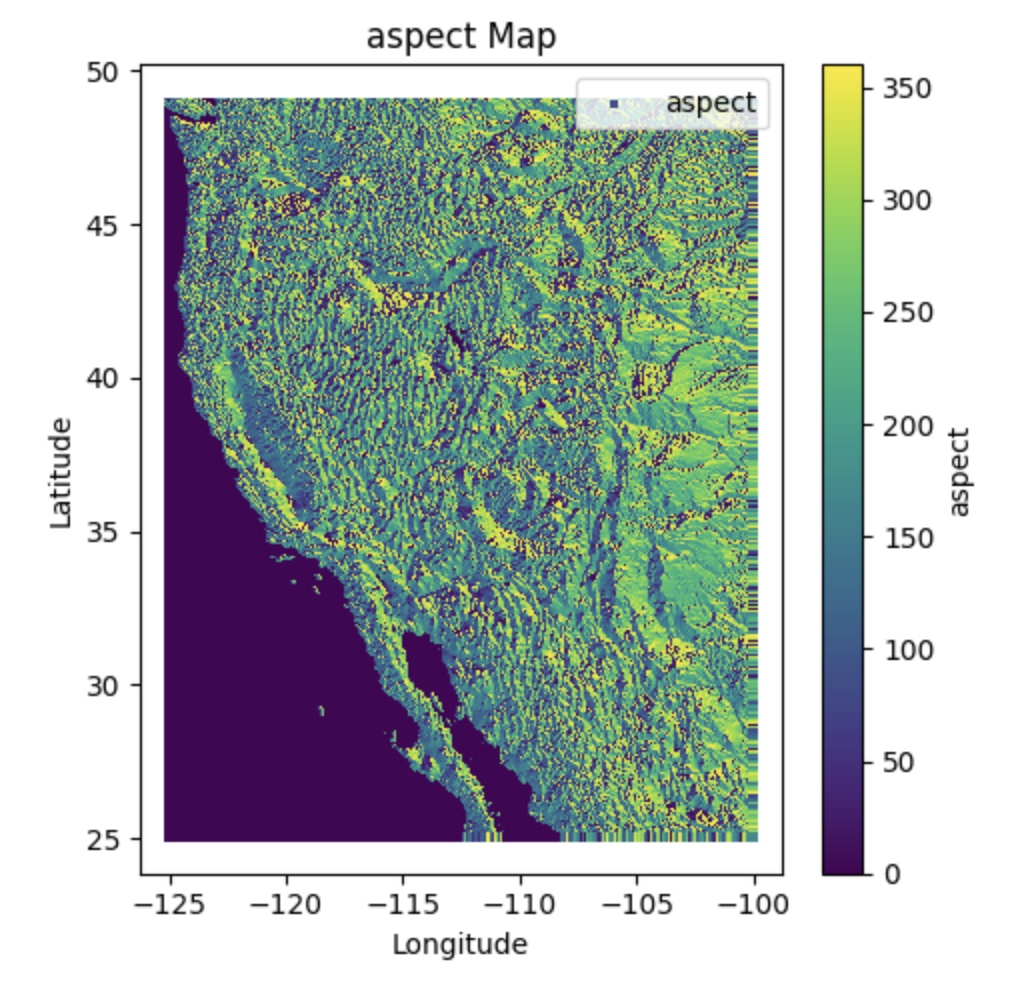
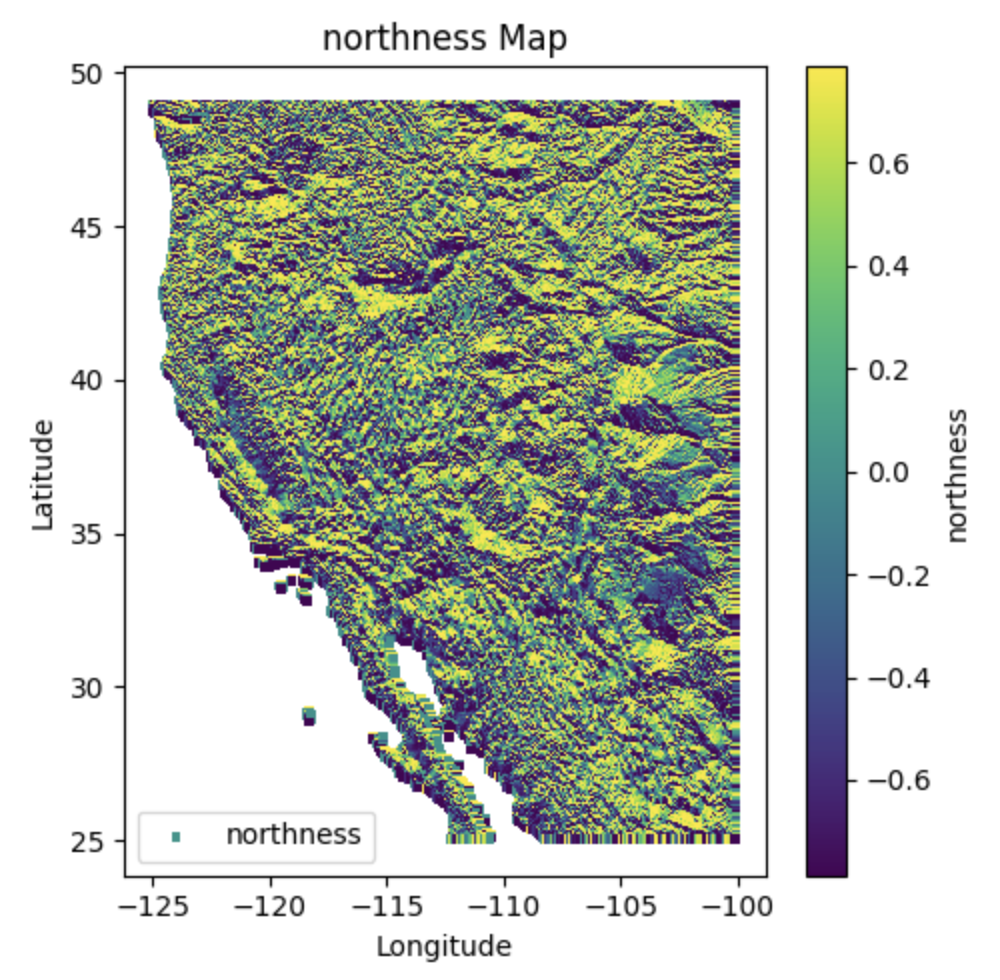
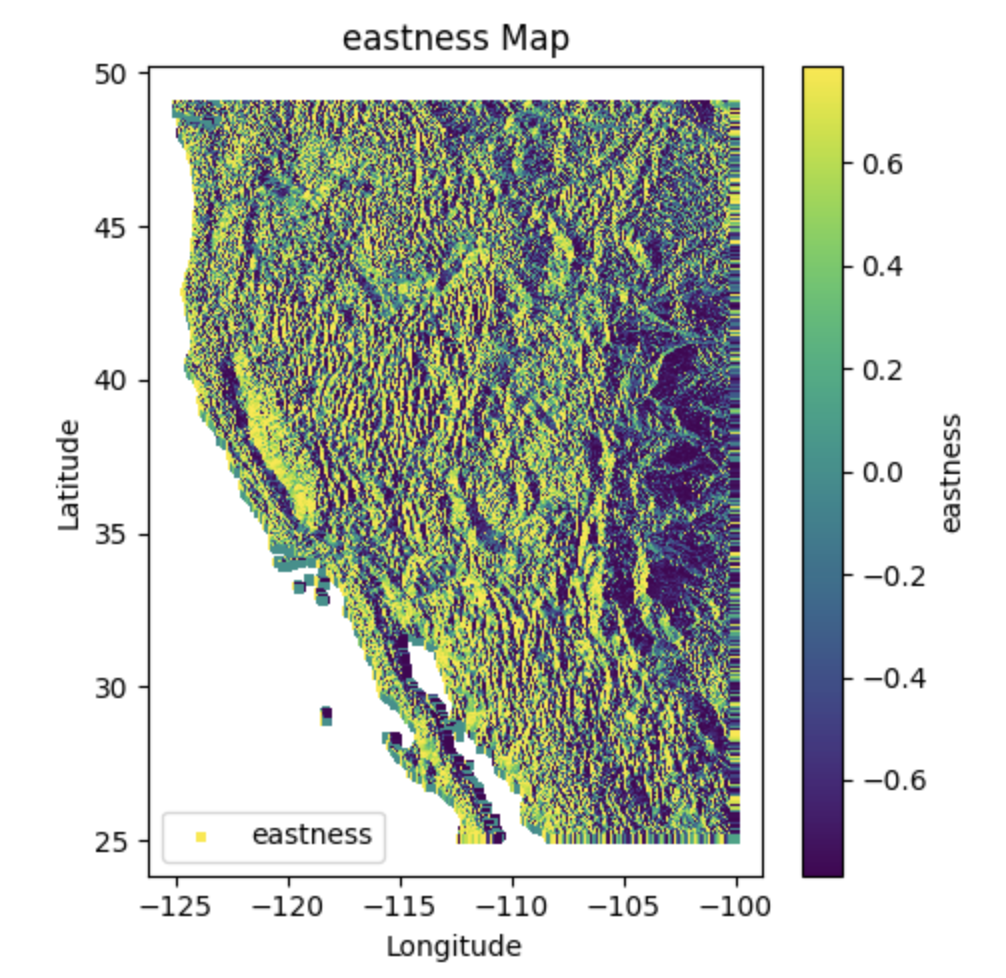
DEM Dataset#
A Digital Elevation Model (DEM) is a digital representation of the topography of a surface, such as the Earth’s terrain or the surface of another celestial body. It consists of a grid of elevation values, where each cell in the grid represents the elevation at a specific location. DEMs are widely used in various fields, including geography, geology, hydrology, environmental modeling, urban planning, and 3D visualization.
Characteristics#
Product/Data Type: SRTM 90m Digital Elevation Model (DEM)
Nominal Data Array Dimensions: 5° x 5° tiles
Spatial Resolution: 90 meters (at the equator)
Temporal Resolution: Single-time snapshot (data captured during the SRTM mission in 2000)
Vertical Accuracy: Less than 16 meters error
Data Format: ArcInfo ASCII and GeoTiff
Coverage: Western USA
Projection: WGS84 datum, geographic coordinate system
DEM data is typically stored in raster formats such as GeoTIFF, ASCII grid, or Esri GRID. DEM data is typically stored in raster formats such as GeoTIFF, ASCII grid, or Esri GRID. Additional information such as coordinate system, spatial resolution, and metadata may also be included in the data file.