✓Clustering as discovery: unsupervised grouping of earthquake spectra revealed cyclic source changes tied to injection at The Geysers.
Holtzman, B. K., Paté, A., Paisley, J., Waldhauser, F., & Repetto, D. (2018). Machine learning reveals cyclic changes in seismic source spectra in Geysers geothermal field. Science Advances, 4, eaao2929.
✓Method choice matters: PCA and hierarchical clustering head-to-head on volcano seismic spectra — different tools see different regimes.
Unglert, K., Radić, V., & Jellinek, A. M. (2016). Principal component analysis vs. self-organizing maps combined with hierarchical clustering for pattern recognition in volcano seismic spectra. Journal of Volcanology and Geothermal Research, 320, 58–74.
✗The elbow ritual under fire: the field’s default way of choosing k picks wrong — a direct argument for better diagnostics.
Schubert, E. (2023). Stop using the elbow criterion for k-means and how to choose the number of clusters instead. ACM SIGKDD Explorations Newsletter, 25(1).
Clustering has produced real geoscience discoveries — and its default rituals are under active critique.
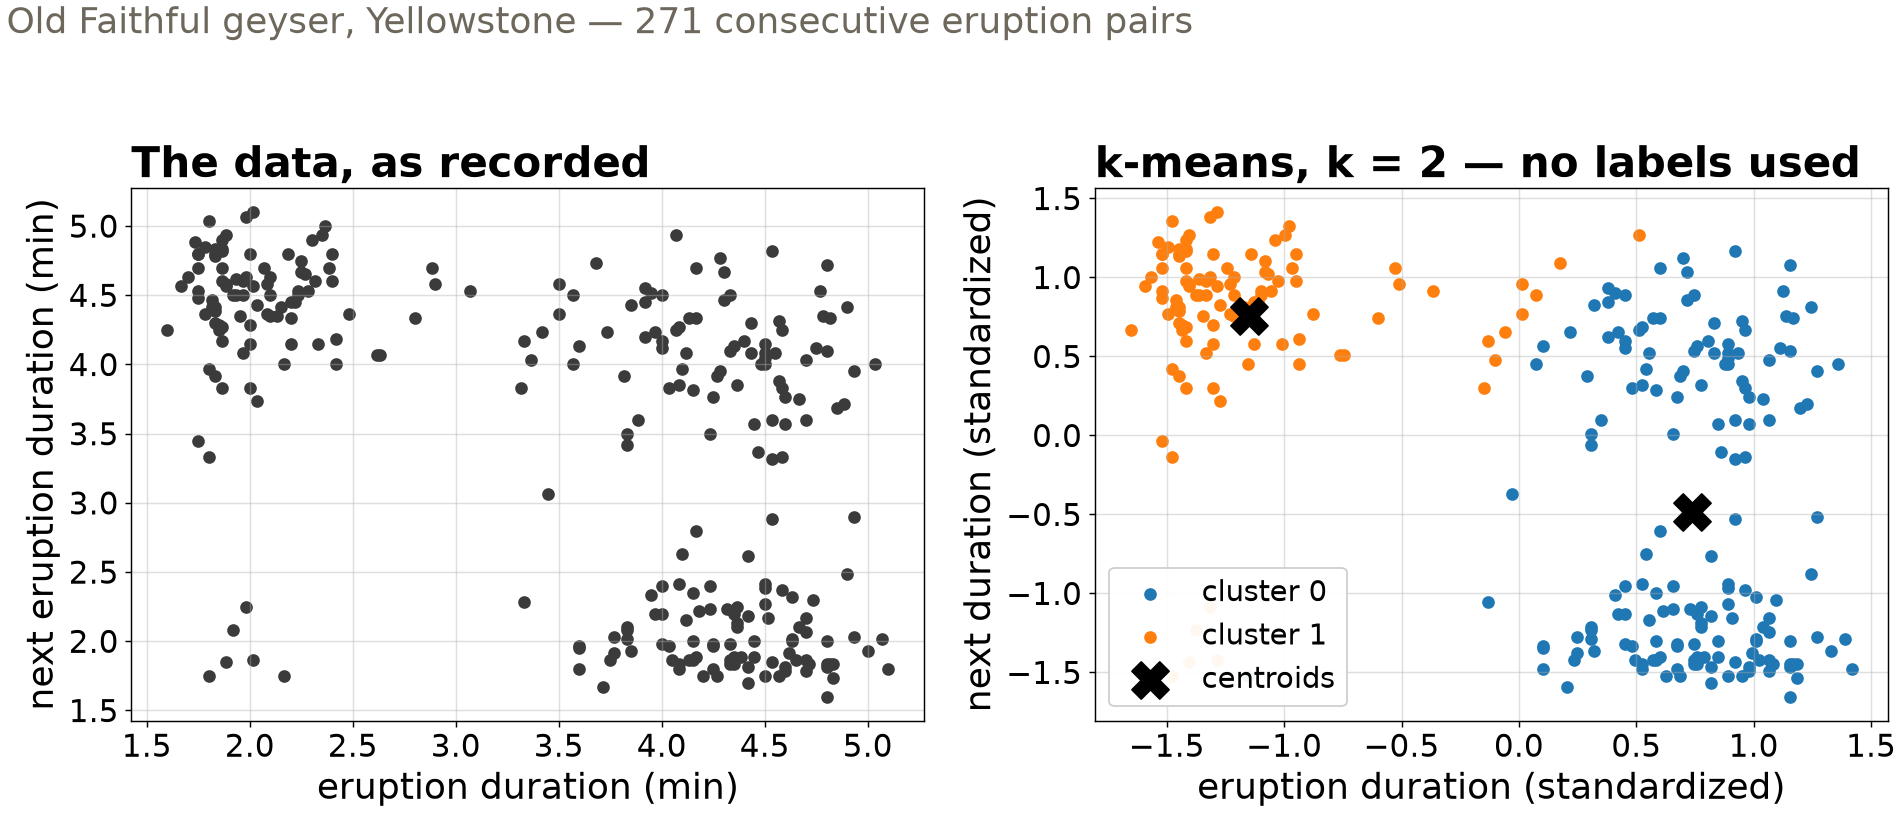
Two regimes, zero labels
The regimes are visible before any algorithm runs — k-means only formalizes what the geometry already says.
Distance is the decision
Every clustering method starts from a distance metric — k-means uses Euclidean, the straight line in feature space
Features with large numeric ranges dominate the distance → standardize first
Both Old Faithful axes are minutes — a coincidence; today’s seismic features span orders of magnitude
Choosing the distance is choosing what “similar” means — a scientific decision, not a default.
The k-means loop
Guess k centroids → assign each data sample to the nearest → re-center at the cluster means → repeat
Minimizes within-cluster scatter — but only to a local minimum
Different starts, different clusters → run many restarts, keep the best
Cheap, fast, everywhere — and never guaranteed to find the best partition. Restart it.
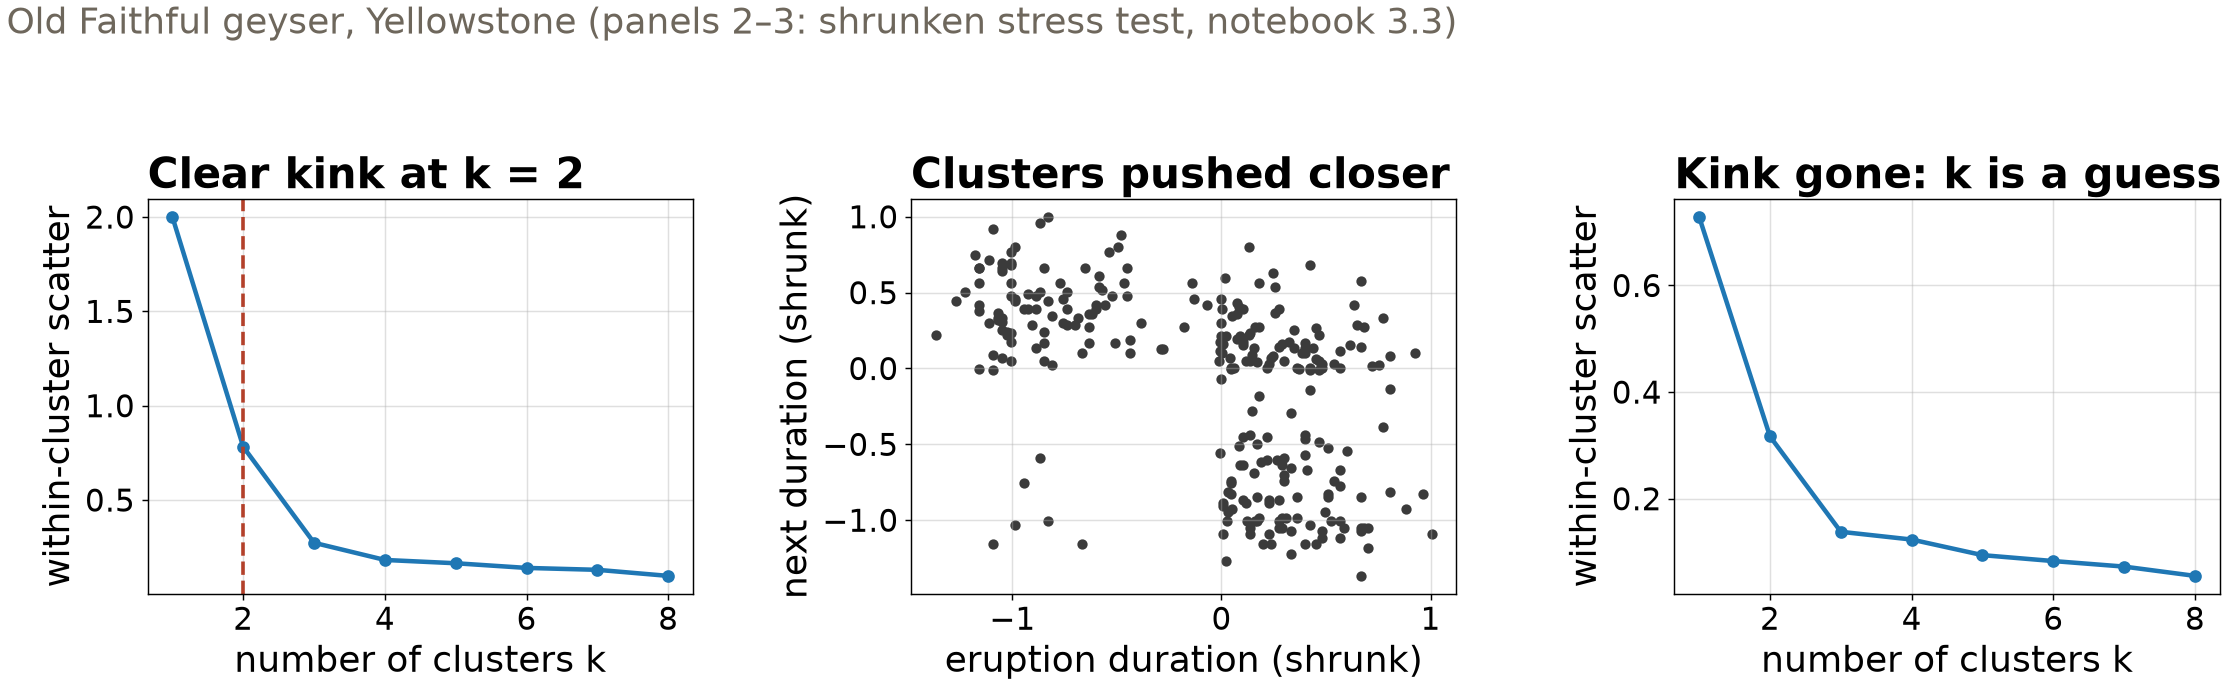
Choosing k: the elbow, honestly
Diagnostics are suggestive, never proof: the kink at k = 2 vanishes when the regimes blur — and the data do not warn you.
A second opinion: the silhouette
0.56 silhouette score — Old Faithful, k = 2
Per sample: (nearest-other-cluster distance − own-cluster distance) / the larger of the two. Ranges −1 (wrong cluster) through 0 (overlapping) to +1 (tight, well separated); the score is the average.
One number for cohesion vs separation — under this distance, on these features. Another lens, not a verdict.
Exercise preview: volcanic and tectonic sources, no labels
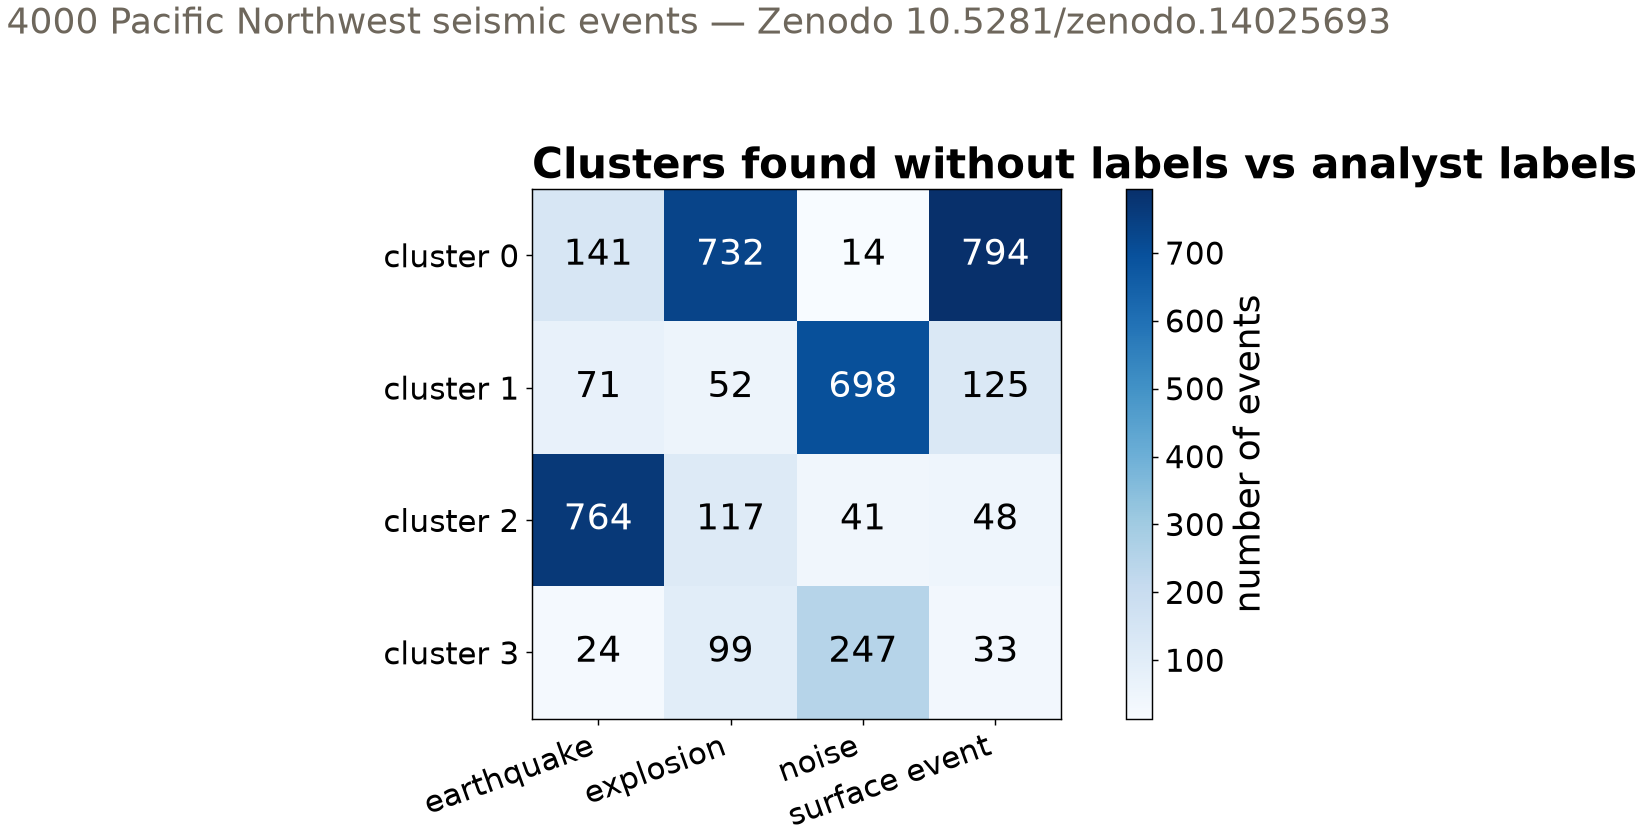
Unaided, k-means finds earthquakes and noise; explosions and surface events share a cluster — shallow sources look alike. V-measure 0.38 against the analyst labels.
The unsupervised toolkit
Method
Core idea
You choose
Seismic-exercise example
k-means
minimize within-cluster Euclidean scatter
k, feature scaling
4 clusters in 4000 events
Agglomerative
merge nearest pairs; cut the tree at a height
distance, linkage, cut
dendrogram → cluster IDs
PCA, then cluster
compress correlated features first
number of components
61 features → 15 PCs (80% var.)
Diagnostics
silhouette, elbow; label-based scores if truth exists
which lens to trust
V-measure 0.38 vs analysts
Every row hides a scientific choice — distance, k, linkage, components. The algorithm never makes it for you.
Now run it yourself — open 3.3
pixi run jupyter lab → 3.3_clustering.ipynb
Run the from-scratch k-means on Old Faithful; break it with a bad initialization, fix it with best-of-20
Seismic exercise: vary k from 2 to 8, track silhouette + inertia — does k = 4 stand out?
Compare: clustering without PCA, and agglomerative with 4 clusters — does the V-measure move?